Add metrics to your custom Microservice
In this tutorial we are going to add custom metrics to a custom micro-service, that will be later collected by a monitoring system like the Prometheus Operator.
These metrics will then be available in Grafana to use in personalized dashboards based on user-defined queries.
Pre-Requisites
Before starting, we assume that you have already created the shipping-cost microservice from the Create a custom Microservice tutorial.
Since there can be different libraries to handle custom metrics, we will consider the library provided by our Nodes.js service launcher lc39, used by the Node.js Template. Therefore, javascript will be used as example language for this tutorial. Other languages and frameworks may provide different modes to expose metrics.
More-over, the project where the service has been created must have a monitoring system such as Prometheus configured from the Microservice Monitoring Section:
This monitoring system should also be configured as data source to Grafana, to view metrics inside the dashboards.
Define Custom Metrics
Consider the /shipping-cost route of the micro-service. We want to add a custom metric to count, the number of requests submitted to the endpoint based on the response status code.
Lets create a metrics.js file that exports a getMetrics function:
module.exports.getMetrics = function getMetrics(prometheusClient) {
  const shippingCostCounter = new prometheusClient.Counter({
    name: 'custom_shipping_cost_metric',
    help: 'Custom metric to count shipping costs requests',
    labelNames: ['status'],
  })
  return {
    shippingCostRequests,
  }
}
This function will be used by lc39 to decorate the fastify instance with a prometheus client from the fastify-metrics library.
In particular, we are defining a counter called custom_shipping_cost_metric, which represents a value that can only increase monotonically. Also, this value can be grouped by a label called status, based on the http status code returned by the micro-service.
The counter is then stored in a variable called shippingCostCounter, that we will use later on our micro-service to increment the number of the metric.
By default, the metrics collected by the micro-service will be exposed under the /-/metrics path.
Now, lets commit our changes to the micro-service and configure the new metrics endpoint from the Console.
Expose Metrics Endpoint
Go to the shipping-costs micro-service configuration: since the Service Monitor has been enabled, you can see a new Monitor tab under the readiness and liveness routes.
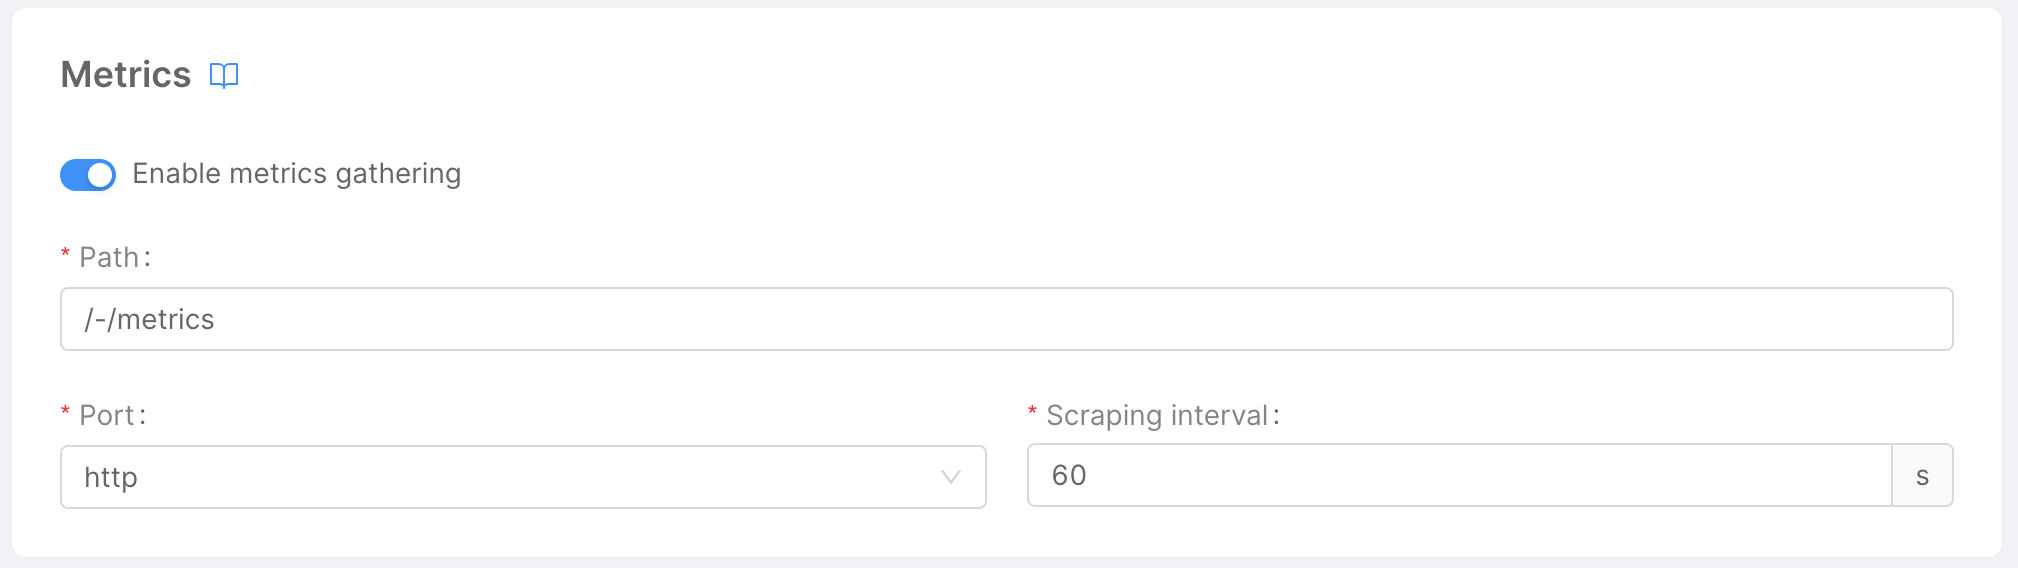
This section enables on Deploy the creation of a Service Monitor resource, that will instruct the monitoring system to collect metrics every 60 seconds from the /-/metrics endpoint.
Now save the configuration with the current version of the micro-service containing the Prometheus Client and release it.
Access the metrics endpoint:
If you have a direct access with kubectl to the environment you have deployed your application, try to access locally the shipping-cost micro-service using port-forwarding on port 3000
kubectl port-forward svc/shipping-cost 3000:80
Now let's make the following http request to the service using curl:
curl localhost:3000/-/metrics
You should receive a text/plain content type having a structure like this:
# HELP custom_shipping_cost_metric mia platform plugin custom metric
# TYPE custom_shipping_cost_metric counter Custom metric to count shipping costs requests
custom_shipping_cost_metric = 0
Update custom metrics
Now custom metrics have been deployed, but they are not updated automatically by the micro-service.
As we said before, the goal of the custom metric is to count the number of either successfull or failed requests.
So, we have to edit the handler code of the /shipping-cost endpoint to access our custom metric and increment it.
async function handler(req, rep) {
  // ... get customerEmail
  let customerCrudRes;
  try {
    customerCrudRes = await crudClient.get(`/customers/`, {
      query: { email: customerEmail },
    });
  } catch (error) {
    this.customMetrics.shippingCostCounter.inc({status: 404})
    return rep.code(404).send({ error: "Customer does not exist" });
  }

  const [customer] = customerCrudRes.payload;

  let orderCrudRes;
  try {
    orderCrudRes = await crudClient.get(`/orders/count`, {
      query: { customerId: customer._id },
    });
  } catch (error) {
    this.customMetrics.shippingCostCounter.inc({status: 404})
    return rep.code(503).send({ error: "Error in Order collection" });
  }

  const numberOfOrders = orderCrudRes.payload;

  const shippingCost =
    numberOfOrders > 0 ? DEFAULT_SHIPPING_COST : NEW_CUSTOMER_SHIPPING_COST;

  this.customMetrics.shippingCostCounter.inc({status: 200})
  return rep.code(200).send({ shippingCost });
}
The prometheus client defined before, along with its metrics, can be accessed inside the handler's scope from the variable customMetrics: here, at each point of the code that we're returning a response, we increment the counter's value by calling the inc() function.
Also, since we wanna group metrics based on the status code provided by the endpoint, we are passing to the function the value of the label status, so that there will be a different counter for each value of the status label.
Now, you can release the changes on the micro-service and release the new version. By performing http requests, you can see from the metrics endpoint the increase of the metric custom_shipping_cost_metric.
Test the behavior of your metrics:
Metrics can be tested also by using TDD! Let's take the shipping-cost unit test written during the previous tutorial and add an additional assert for the metrics response.
  t.test("Default customer shipping cost", async (t) => {
    const NEW_CUSTOMER_SHIPPING_COST = 5.99;
    const DEFAULT_SHIPPING_COST = 10;
    const CRUD_BASE_URL = "http://crud-service";
    const getCustomerScope = nock(CRUD_BASE_URL)
      .get(`/customers/`)
      .query({ email: mockedCustomer.email })
      .reply(200, [mockedCustomer]);

    const getOrderScope = nock(CRUD_BASE_URL)
      .get(`/orders/count`)
      .query({ customerId: mockedCustomer._id })
      .reply(200, 1);

    const response = await fastify.inject({
      method: "GET",
      url: "/shipping-cost",
      query: {
        customerEmail: mockedCustomer.email,
      },
    });
    const metricsResponse = await fastify.inject({
      method: "GET",
      url: "/-/metrics"
    });
    // ... endpoint response asserts
    const counter = getCounter(metricsResponse.payload) // extract counter value from metricsResponse
    t.strictSame(counter, 1);
  });
Since the response of the /-/metrics endpoint is of content type text/plain, you have to parse the metric line, for example with a getCounterutility function.
There are several libraries that parse the content of prometheus metrics, such as parse-prometheus-text-format.
Create Grafana Dashboards based on Custom Metrics
Now that custom metrics are correctly exposed by the micro-service and collected by the monitoring system, lets go over Grafana and create a new dashboard.
Grafana lets you create panels of different kinds containing one or more PromQL queries, which will be executed on the default datasource where your custom metric is stored.
In this case, we want to create a time-series visualization where we can group the different values of the counter by the status, that either can be 200, 404 or 503. We will call the panel Shipping Costs Requests and insert the following PromQL query
sum by(status) (custom_shipping_cost_metric)
This query will:
- fetch all series matching metric
custom_shipping_cost_metric; - calculates sum over dimensions while preserving label
status.
Once you've executed this query, you'll see that the time-series visualization is showing the metric representing the number of requests received by the service over the time range provided.
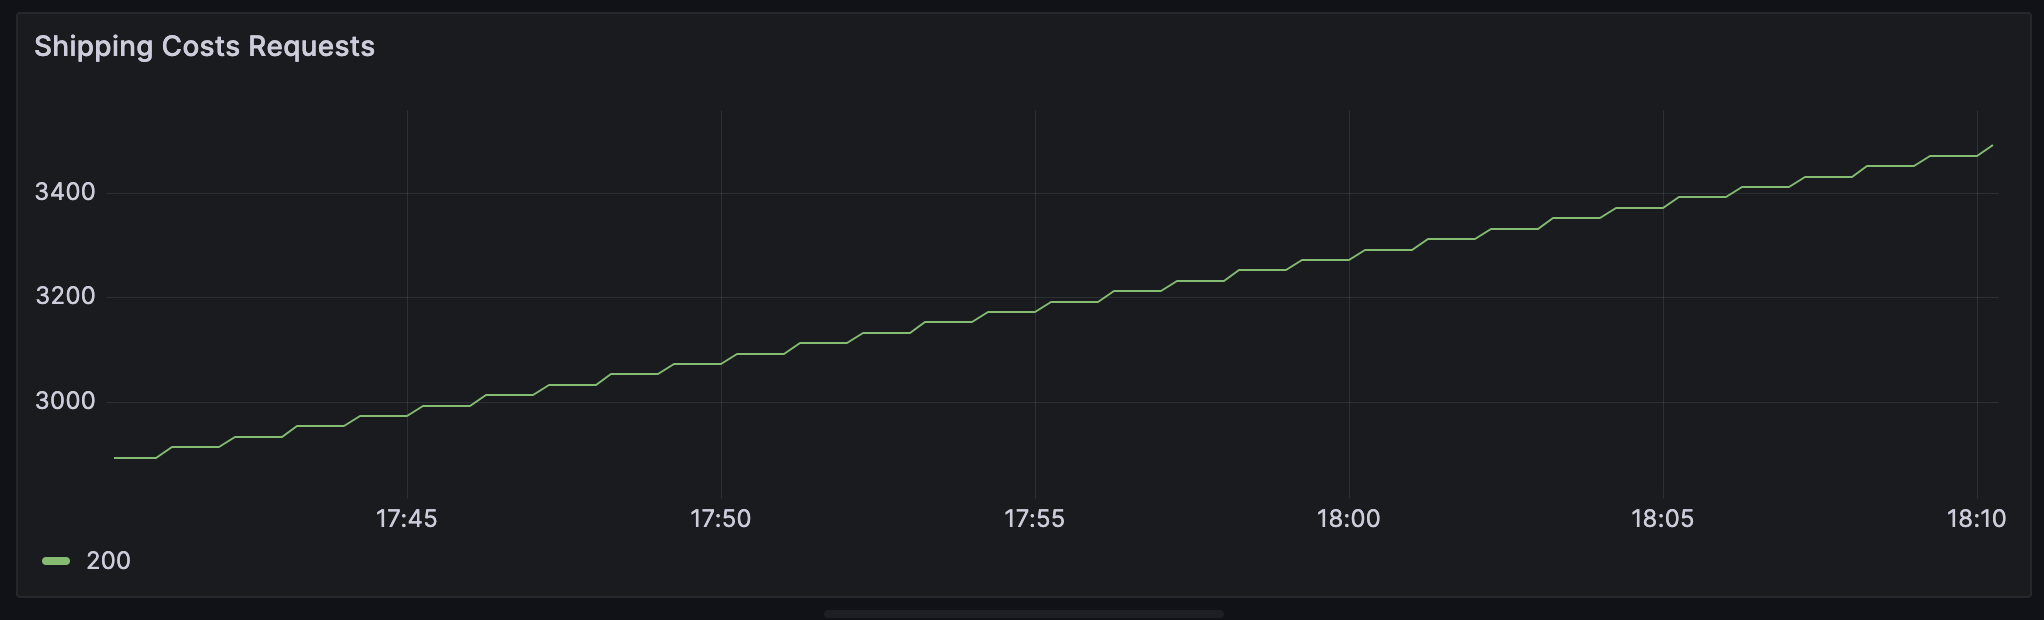
If you try to perform GET requests to the "/shipping-cost" endpoint, you will see the counter increase. That's it, you have defined your custom metric and shown it on a Grafana visualization!
This dashboard can also be embedded into the Console using the Dashboard Section.