Set Requests and Limits of a Microservice
The ultimate objective is to find the optimal values for requests and limits of a microservice by performing a load test, to know more about those values check this out.
Load testing generally refers to the practice of modeling the expected usage of a software program by simulating multiple users accessing the program concurrently.
Testing a Microservice
To test a microservice, a series of operations needs to be applied to load and stress that specific part of the project. Usually, this process consists in:
-
Understanding the very purpose of the tested microservice
-
Finding specific APIs using that service
-
Creating multiple requests to those APIs
Testing the microservice-gateway
This service is responsible for the orchestration of API decorators.
In the Console Design area you can create a few microservices to implement decorators and make various requests to the endpoints associated with those services.
Load Testing Tools
In order to reproduce the interaction of multiple users, we can leverage different load testing tools among which:
In this tutorial, we will focus on Locust as our main load testing tool. However, the following explanation can be useful even when using any other testing tool.
Locust
Locust is a Python library for mocking users making requests to your application. To configure the types of actions and access points that need to be tested, Locust leverages a configuration file referred to as the Locust file.
Locust file
A Locust file makes use of classes mocking different types of users, and each class defines a series of tasks to be reproduced by that user. Further information regarding the creation of Locust files can be found in the official documentation.
Here’s an example of a Locust file instance:
import time
from locust import task, between
from locust.contrib.fasthttp import FastHttpUser


class User(FastHttpUser):
    wait_time = between(1, 1.5)

    @task
    def crud_service(self):
      self.client.get("/v2/my_collection/?_st=PUBLIC,DRAFT")

    @task(2)
    def authorization_service(self):
          self.client.get("/echo-acl-client-type-secreted",
          headers={'client-key': 'someClientKeyValue'})

    def on_start(self):
        print("A new test is starting")
You can use this Locust file as a template to test your application.
In this tutorial we will create a load-testing folder and save the file as my-locustfile.py
User
The class FastHttpUser defines a fast and lightweight user implementing a geventhttpclient. The property wait_time instead, will make the simulated users wait between 1 and 1.5 seconds after each task.
Tasks
We defined two tasks by decorating functions with a tag @task and assigning a specific weight between brackets:
- crud_service will be used to test services responsible for retrieving the collection my_collection from the database (please, keep in mind operating on a database during a load test may require an appropriate database scaling)
- authorization_service will be used to test a login operation with an appropriate client-key
Weights
Tasks are picked randomly. However, the weight determines the probability of that task to be executed. In this configuration, it will be two times more likely for Locust to pick authorization_service than crud_service.
Executing a Load Test with Locust
Launching a Locust Instance Locally
Once you created a Locust file, you need to launch a Locust instance to test your application. You can execute a Locust instance locally by calling:
locust -f path/to/your/locustfile
Following the previous example you can execute:
locust -f ./load-testing/my-locustfile.py
Now, you can access your Locust instance by connecting to http://localhost:8089.
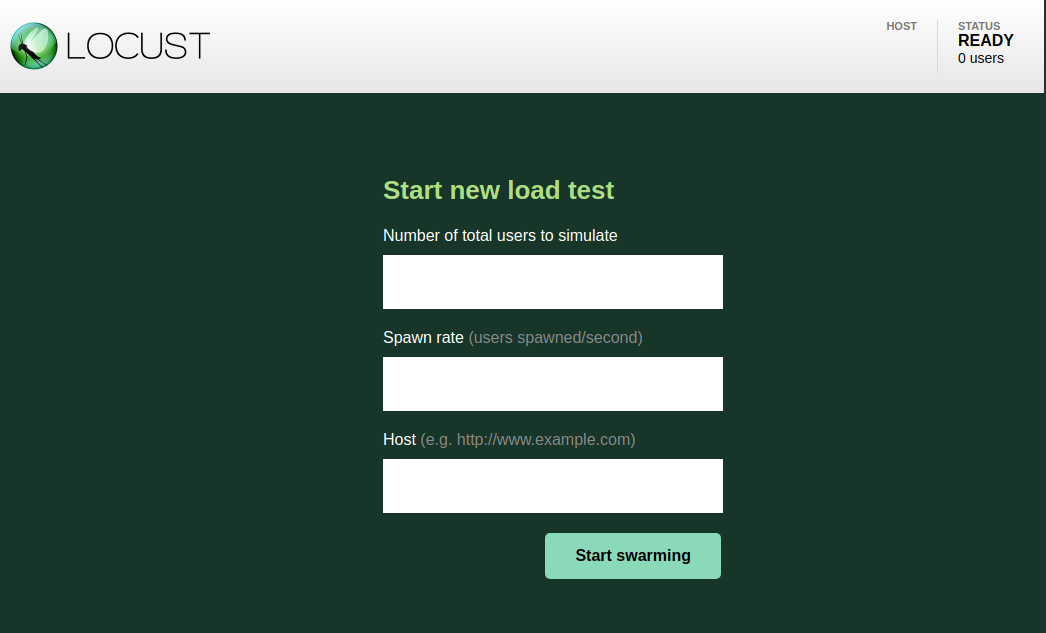
This will prompt a new Locust window where you can specify:
- users: the total number of users testing your application. Each user opens a TCP connection to your application and tests it.
- spawn rate: the number of users that will be added for each second to the current users, until the total amount of users is reached.
- host: the host of the application you wish to test.
Later in the process we will learn how to start a Locust instance from the cluster. However, launching a Locust instance locally is a necessary step to assess the correctness of your test configuration.
Select a value for users and spawn rate. In this example we choose 50 users and a spawn rate of 10.
When executing a Locust instance locally, it might be convenient to access the desired host using localhost. In our case, this might be easily achieved connecting to an existing cluster and using port forwarding to redirect a service to our local machine:
kubectl -n YOUR_NAMESPACE port-forward service/YOUR_SERVICE PORT
For instance, to redirect the service api-gateway from development namespace you can execute:
kubectl -n development port-forward service/api-gateway 8080
so you can use http://localhost:8080 as your host value.
You can now click Start Swarming and begin your test.

Here’s how a working example of a Locust swarm test should look like. Once made sure your test configuration is correct, you can move to the execution of a swarm test directly from the cluster.
Launching a Locust Instance From the Cluster
On most occasions, it will be useful to have access to cluster resources to run your tests (mocking thousands of requests per second can be pretty computationally demanding!). In this case, an instance of Locust needs to be run directly from the cluster.
This tutorial requires the usage of a preconfigured namespace.
In order to continue with the tutorial, you may need to ask your Mia Platform referent to give you access to a namespace created for load testing purposes.
In this tutorial, we will refer to a specific namespace called load-testing. However, the following explanation is valid for any namespace on K8s.
Connecting to Kubectl
First you need to make sure to have a proper connection to Kubectl. You can visualize your current configuration running:
kubectl config view
Pushing your Locust file to the cluster
Once you are connected to the cluster, you can create a config map containing your Locust instance with the following command:
kubectl -n YOUR_NAMESPACE create configmap YOUR_LOCUST_FILE --from-file ./path/to/your/locust_file
This command will create a config map called YOUR_LOCUST_FILE on your K8s namespace. You can later edit your configmap with:
kubectl -n YOUR_NAMESPACE edit configmap YOUR_LOCUST_FILE
or overwrite with:
kubectl -n YOUR_NAMESPACE create configmap YOUR_LOCUST_FILE --from-file ./path/to/your/locust_file --dry-run=client -o yaml | kubectl apply -f -
If you are using load-testing namespace, and you want to create a my-loadtest-locustFile configmap you can execute:
kubectl -n load-testing create configmap my-loadtest-locustfile --from-file ./load-testing/my-locustfile.py
and successively overwrite my-loadtest-locustfile with:
kubectl -n load-testing create configmap my-loadtest-locustfile --from-file ./load-testing/my-locustfile.py --dry-run=client -o yaml | kubectl apply -f -
To apply these modifications, it might be necessary either to create a new pod or to restart the deployment mounting the config map you previously created.
Creating a new K8s pod
You can create a new pod by deleting the existing one. Kubernetes will automatically start a new pod. For instance, if you are using load-testing namespace you can execute:
kubectl -n load-testing get pods
to retrieve the names of the existing pods, then by executing
kubectl -n load-testing delete locust-worker-7f9f8c955f-l8nc4
you can kill the pod locust-worker-7f9f8c955f-l8nc4 and create a new one.
Restarting a K8s deployment
The easiest way to restart a deployment is setting its replicas to 0 and again to 1: You can set replicas of a specific deployment by using:
kubectl -n YOUR_NAMESPACE scale deployment YOUR_DEPLOYMENT --replicas=NUMBER
When using load-testing, you can perform this operation with the following two commands:
kubectl -n load-testing scale deployment locust-worker --replicas=0
kubectl -n load-testing scale deployment locust-worker --replicas=1
Accessing Locust locally
Finally, you will need to access your Locust instance from your local machine. The most straightforward approach is to redirect the cluster instance to a local port, which can be easily achieved with port forwarding. If you are using load-testing namespace you can execute:
kubectl -n load-testing port-forward service/locust 8089
In this example we choose the default Locust port 8089, however, you can choose any port to achieve this result, as long as it matches the local port you access to.
Now you should be able to visualize the Locust interface:

Running a Load Test
In our tests, our goal is to identify requests and limits for multiple user categories. We selected four levels of users representing different user bases. Thus, tests should be performed for each category and will have a different output for each one. To model an increasing amount of users interacting with the console, we will keep spawning a small number of new users every second. This will help us testing real case scenarios where the load on microservices sums up over time. The closer this value is to the total amount of users, the steepest the curve will be in reaching that value. Finally, we exploit Kubernetes DNS records for services and pods, so we can contact services with consistent DNS names instead of IP addresses.
In our tests we will use the following values:
-
users:
50,100,250,500 -
spawn rate:
value selected for users or less(typically 5 - 10 users per second) -
host:
http://SERVICE.NAMESPACE.svc.cluster.local:porte.g. for the api-gateway running on the namespace "my-namespace":http://api-gateway.my-namespace.svc.cluster.local:8080
Monitoring CPU and Memory Usage
A useful tool that can be used to track system performances is Grafana. For the cluster handled by Mia Platform, a series of dashboards has been setup to be ready to use for testing purposes.
Connecting to Grafana
First, you have to connect to https://grafana.mia-platform.eu Here you will be able to visualize CPU and memory usage for each microservice during your tests.
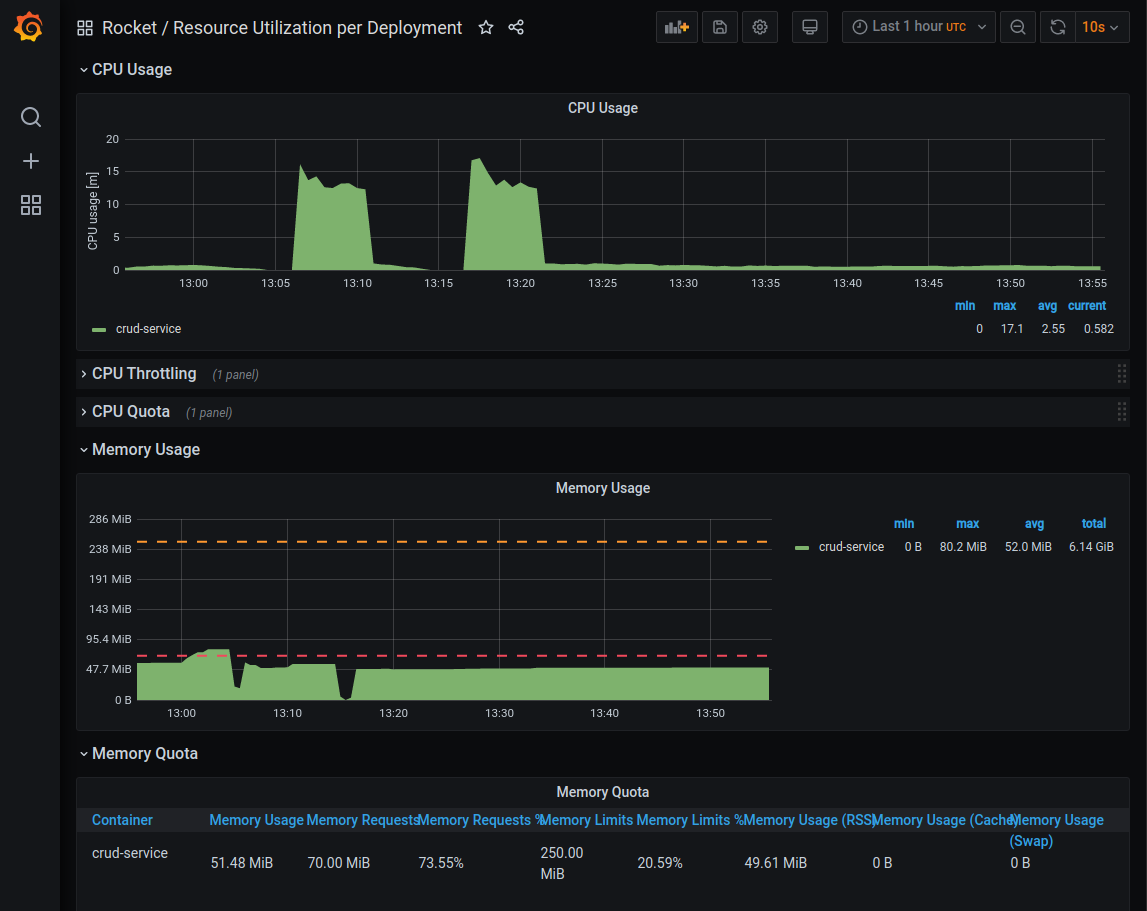
Collecting Outcomes
Once you started a test, you can use Grafana dashboards to monitor the advancement of the test and report your results.
Please keep in mind that the execution of a test should be long enough for cpu and memory usage to have reached a stable situation / a plateau, in order to be considered valid for the inference of requests and limits.
The most important graphs you need to take into consideration are:
- CPU Usage
- CPU Throttling
- Memory Usage
In particular, you should always keep track of maximum values.
Reporting Results
After a test is considered to have reached a plateau, where the CPU and memory levels are stable, you should report this information:
- How the test has been set (e.g. requests to api-gateway + authorization service (no login) - with request and limits set as returned in test before )
- Time range of the test execution (e.g. 22/04/2021 16.00 -16.30 )
- Requests and limits set for the microservice
- Number of users spawned
- Number of requests per second (RPS) served by the console
- Number of failures
- Maximum CPU Throttling level
- Maximum CPU consumption reached during the test
- Maximum Memory consumption reached during the test
Additionally, you can collect reports from the tools you used for the test execution:
- Locust allows you to download from Download Data tab a report in html format and csv files regarding requests, failures and exceptions
- Grafana allows you to create a link or a snapshot of the current dashboard using the share button.
Updating Requests and Limits
From the data you previously collected, you can directly infer if requests and limits have been correctly set for the selected microservice.
Validating a test
There are a few constraints that should be taken into consideration before selecting the next test parameters:
- Requests per second should match almost exactly the number of users spawned (< 0.5% difference)
- Failures should be almost 0
If one of these two conditions is not met during the execution, the test should be stopped and restarted.
If a test fails for one of the aforementioned reasons, you should look for a bottleneck in your test setup. The reason for this result to happen could be linked to other microservices not being correctly configured.
Interpreting results
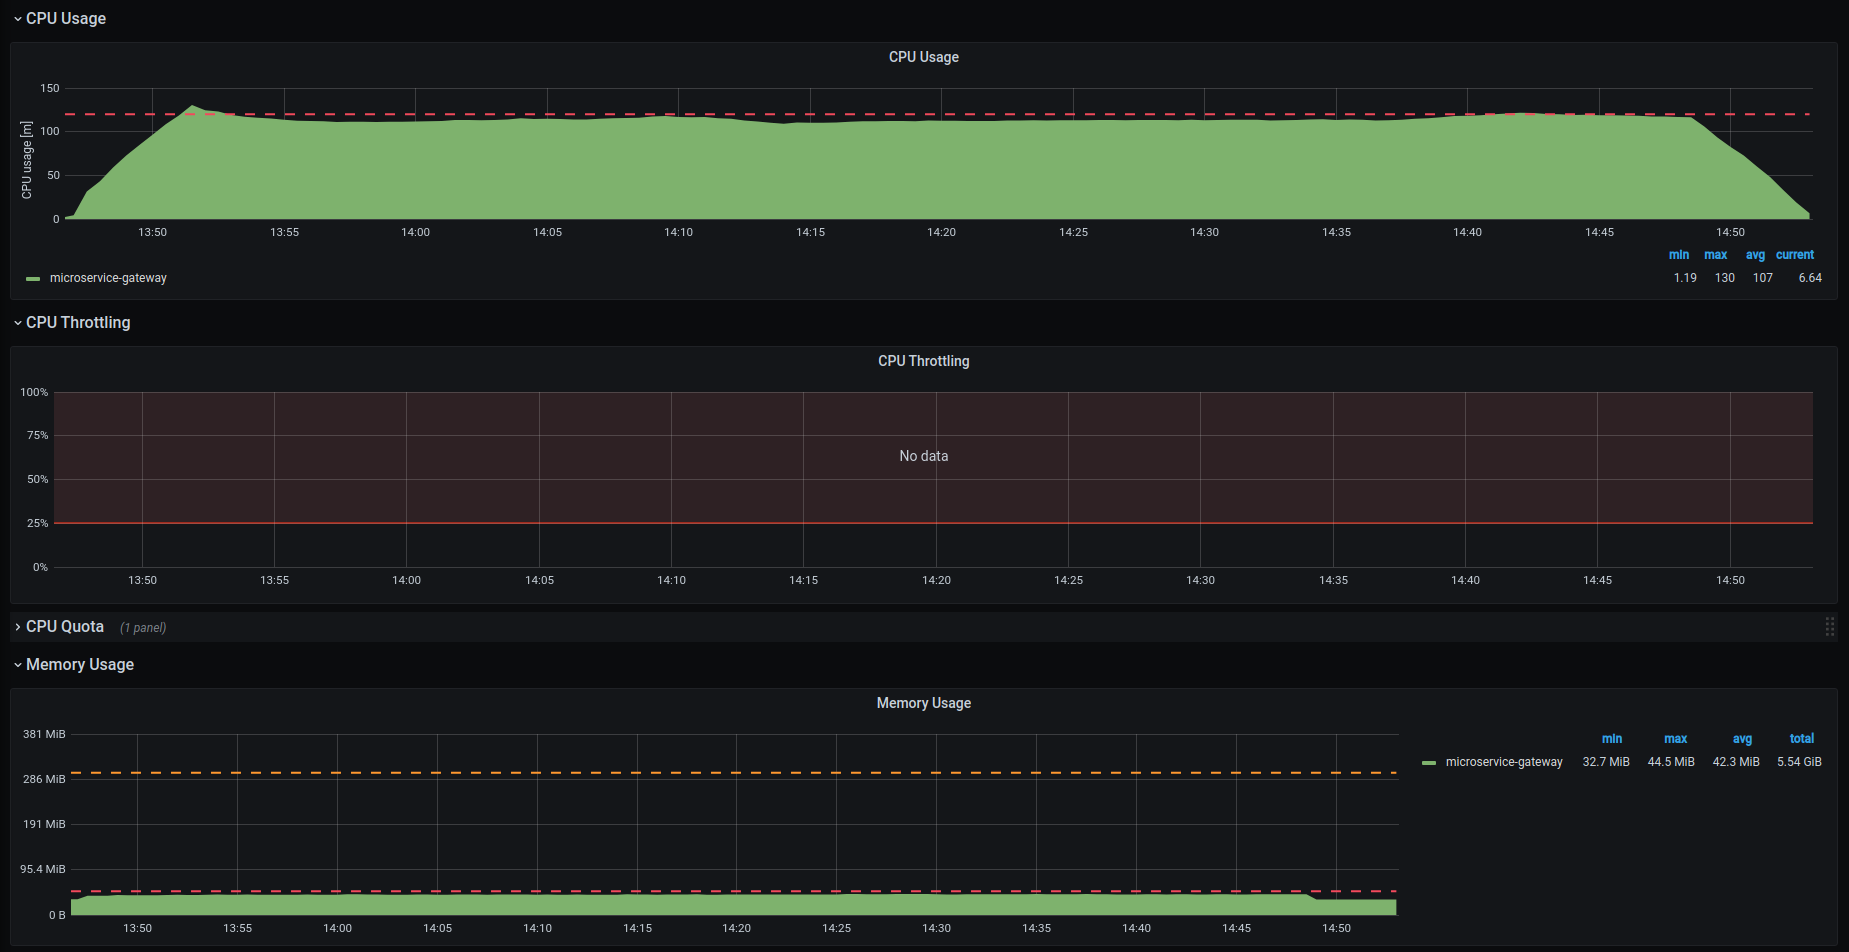
If you successfully passed the previous constraints, you should be able to determine the correctness of requests and limits using these rules:
- CPU usage should always correspond to the CPU requests level specified
- CPU throttling should be 0
- Memory usage should always correspond to the memory requests level specified
If all these conditions are met, you correctly identified request and limit levels!
Here’s an example of a successful test configuration:
During the majority of test cases, one of these conditions could fail. In that case, you need to correctly interpret the outcomes to update the requests and limits for the next test configuration.
If the CPU/memory usage maximum level overcomes the request level you should consider updating the request level to that specific value.
Accordingly, the level of the limits should be updated to be around 3-4 times the value specified for the requests.
Here’s an example of a test configuration where the CPU levels should be updated:
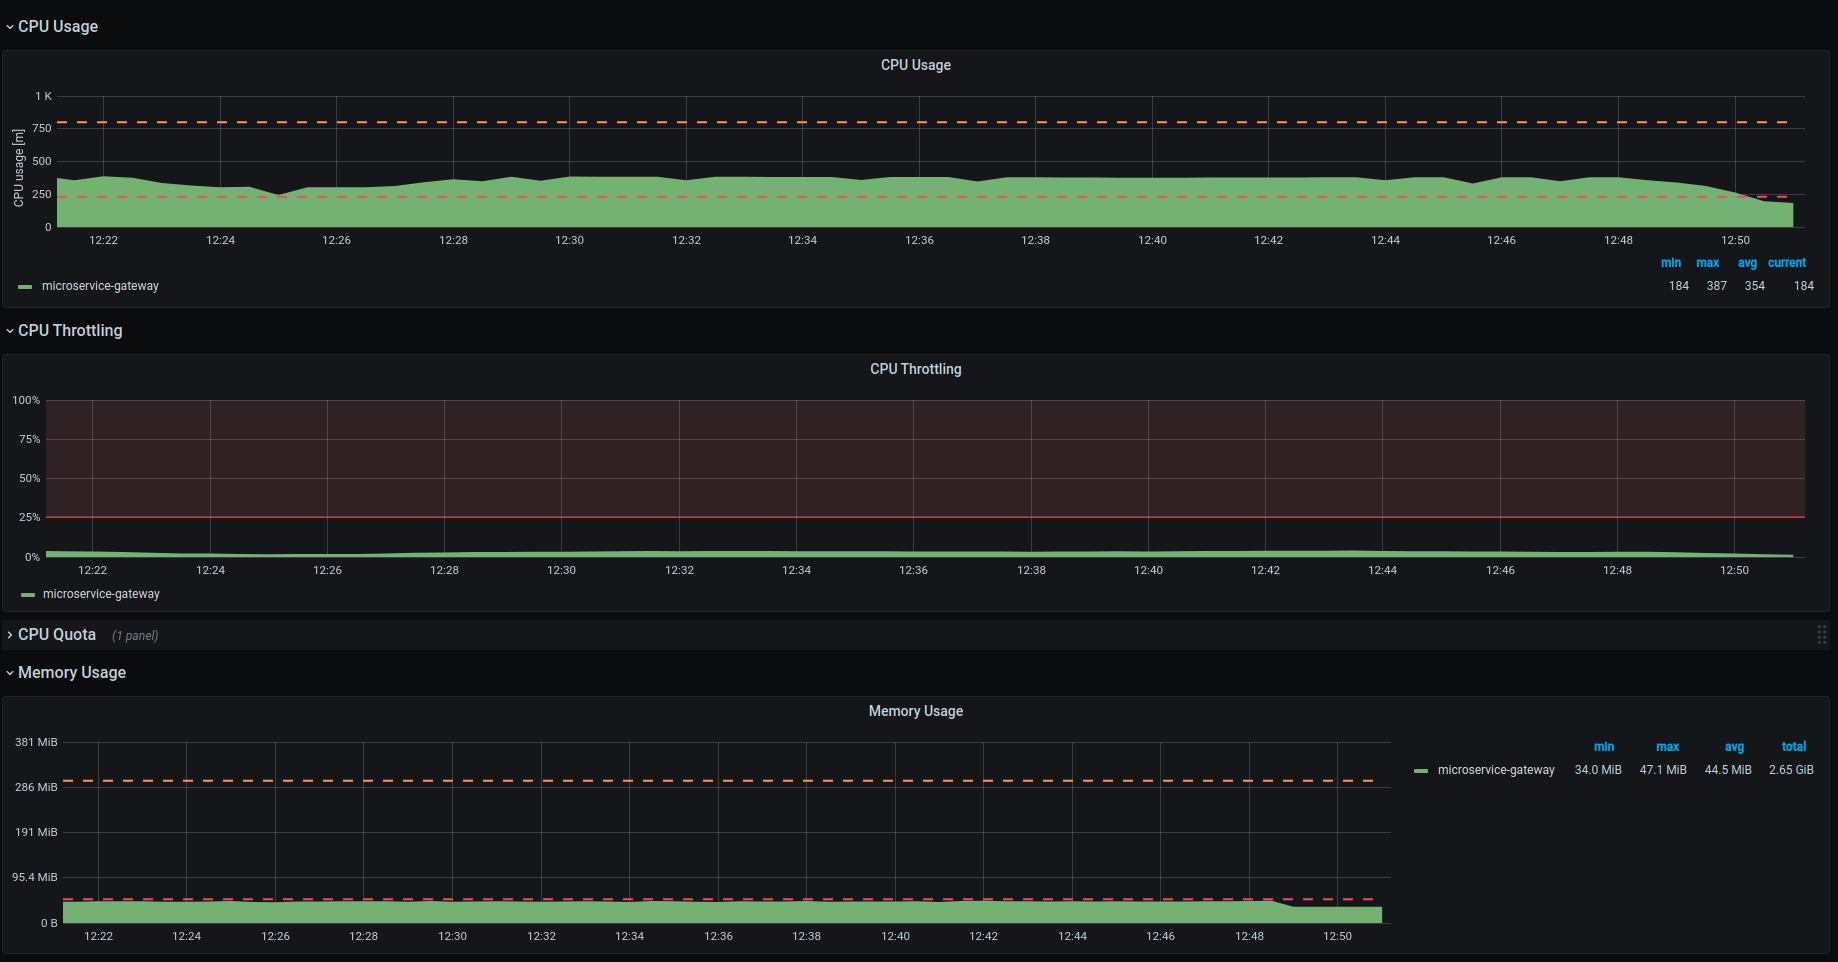
In particular, for the next test setup we will have:
- CPU requests updated from 230 to 380
- CPU limits updated from 800 to 1200