Control Plane UI
The Fast Data Control Plane UI provides a comprehensive visual interface for managing and monitoring your Fast Data v2 pipelines.
This web-based interface allows you to visualize the entire data pipeline architecture, monitor real-time performance, and control runtime states of your Fast Data Engine workloads with just a few clicks.
Artifacts
Fast Data Control Plane shows various nodes that represent different aspects of the overall architecture of Fast Data pipelines.
Data Streams
Data Streams represent the channels through which data flows between different execution steps in your pipeline. In the Fast Data v2 architecture, these are Kafka topics that typically carry Fast Data compliant messages between workloads.
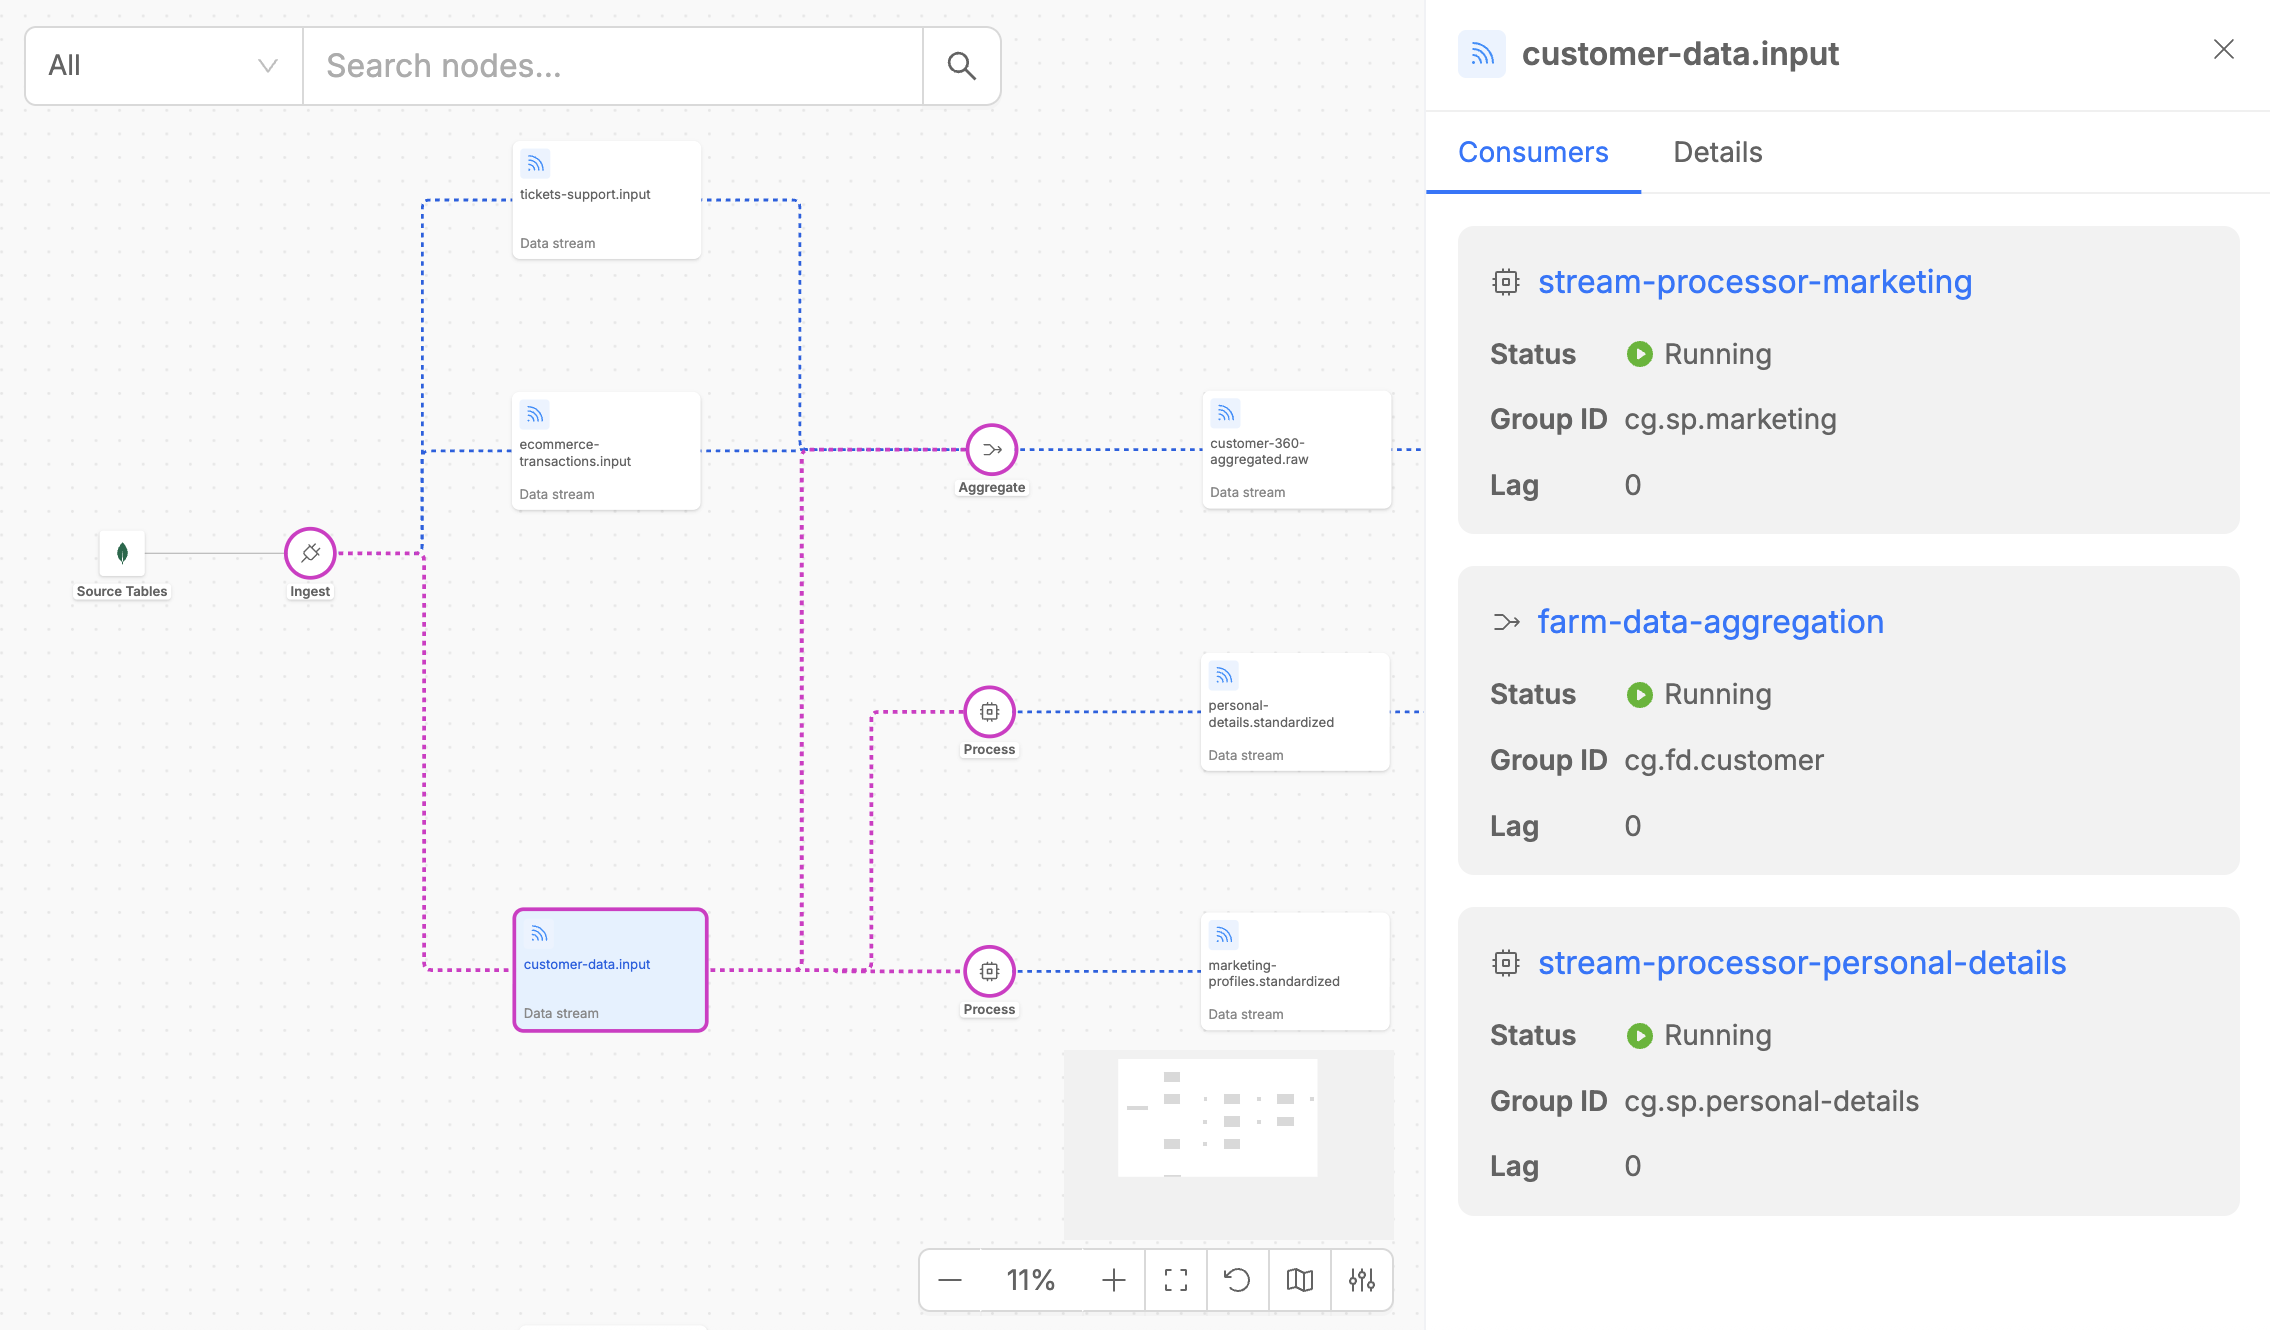
Each Data Stream lists its associated consumers, detailing essential metadata such as consumer names, runtime states, and the consumer groups that define each Fast Data workload.
Persisted Assets
Persisted Assets represent data that is persisted at a certain step of the pipeline. These can be often either sink tables or final data products (Single Views) that result from your Fast Data pipeline operations.
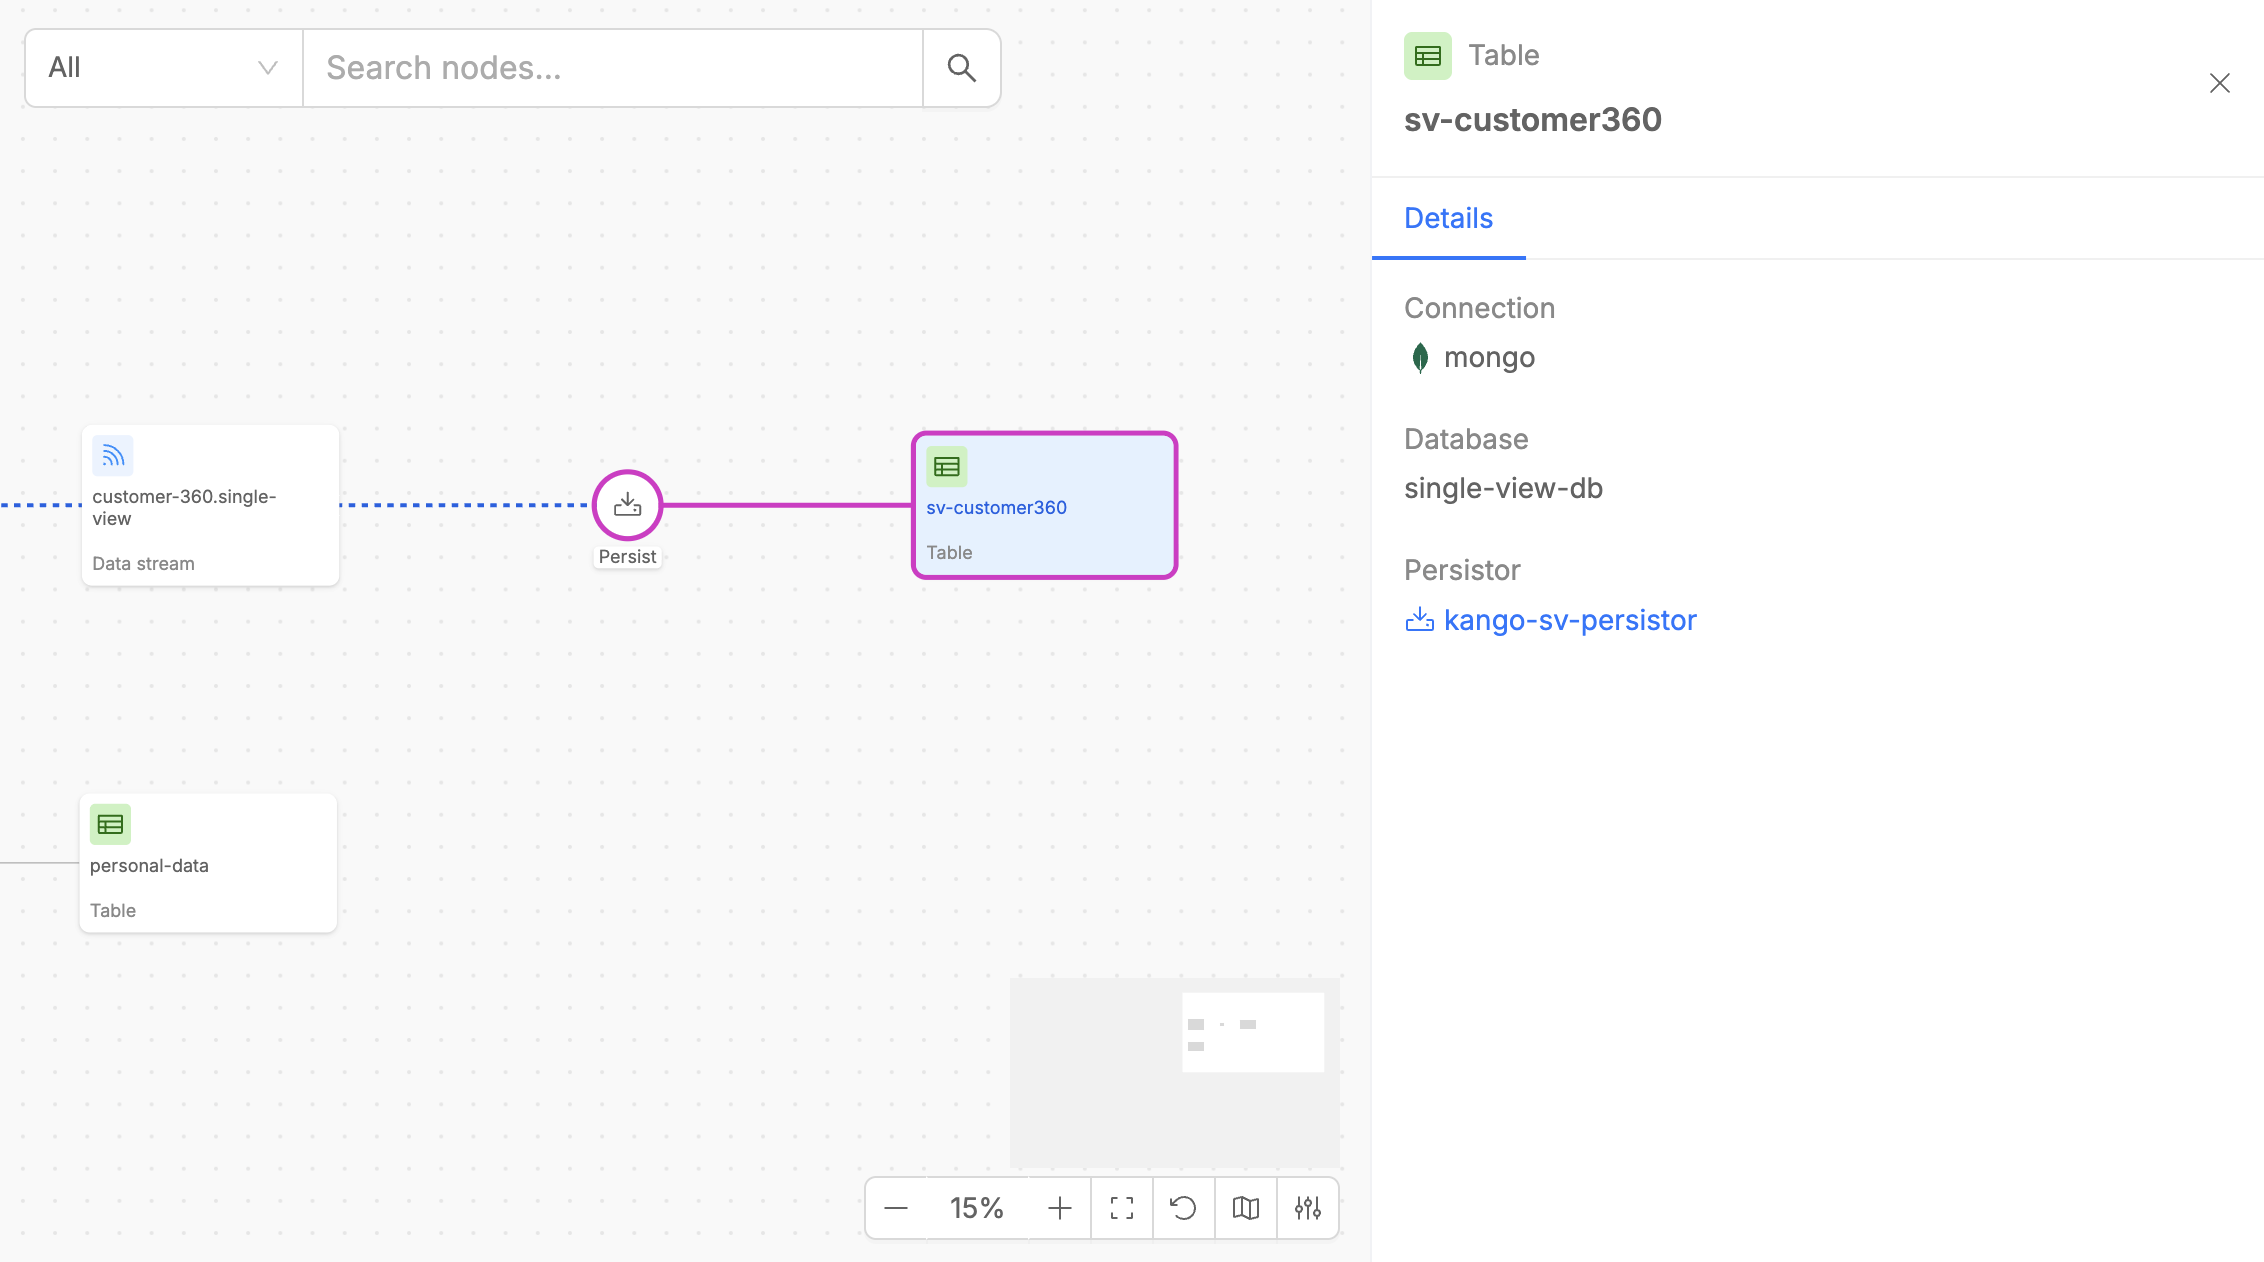
Each Persisted Asset displays useful metadata and other information about the service persistor name.
Source Tables
The Control Plane Canvas allows users to identify the source tables for the data pipeline. These tables are ingested to capture real-time change events for the output data streams.
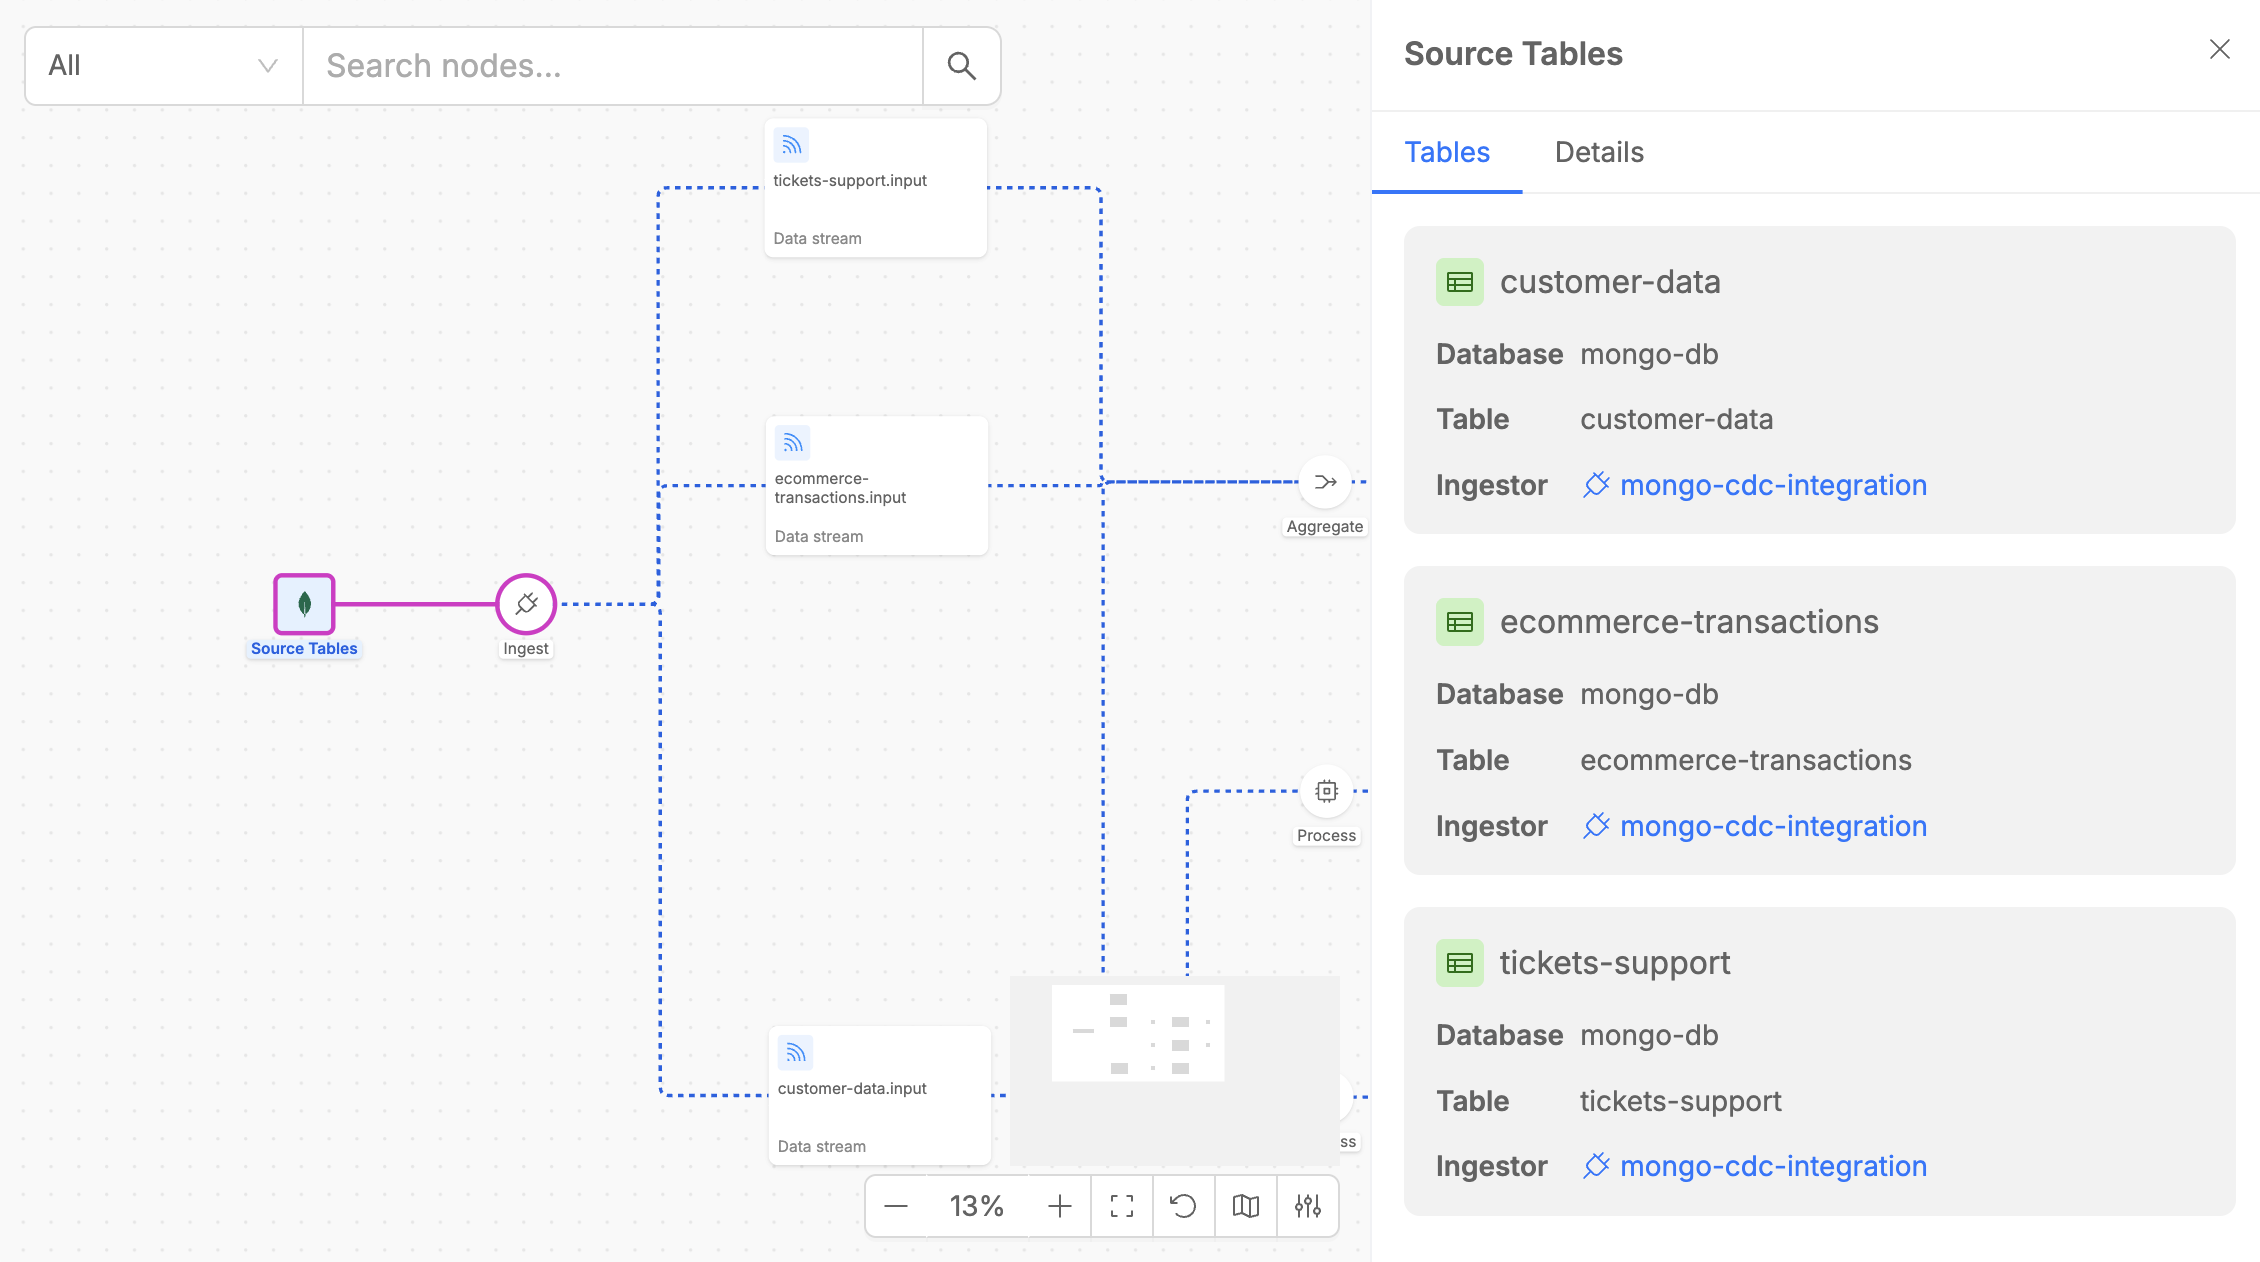
The Source Tables element also displays key details, such as the provider type of the System of Records (SoR) where the tables are hosted.
Execution Steps
Execution Steps are the core processing components of your Fast Data pipeline, implemented by the four specialized workloads of the Fast Data Engine v2. Each step appears as a circular node in the pipeline diagram and represents a specific data processing operation.
Each execution step offers, if supported, functionalities to pause and resume the consumption of data streams along Fast Data pipelines with just on click.
Ingest
The Ingest step acts as Change Data Capture (CDC) from source tables to Kafka streams.
Among Fast Data Engine v2, an ingestor component is represented by Mongezium, that is a CDC from MongoDB to Kafka, that monitors MongoDB change streams in real-time and converts database operations (insert, update, delete) into Fast Data compliant messages that flow to downstream processing steps.
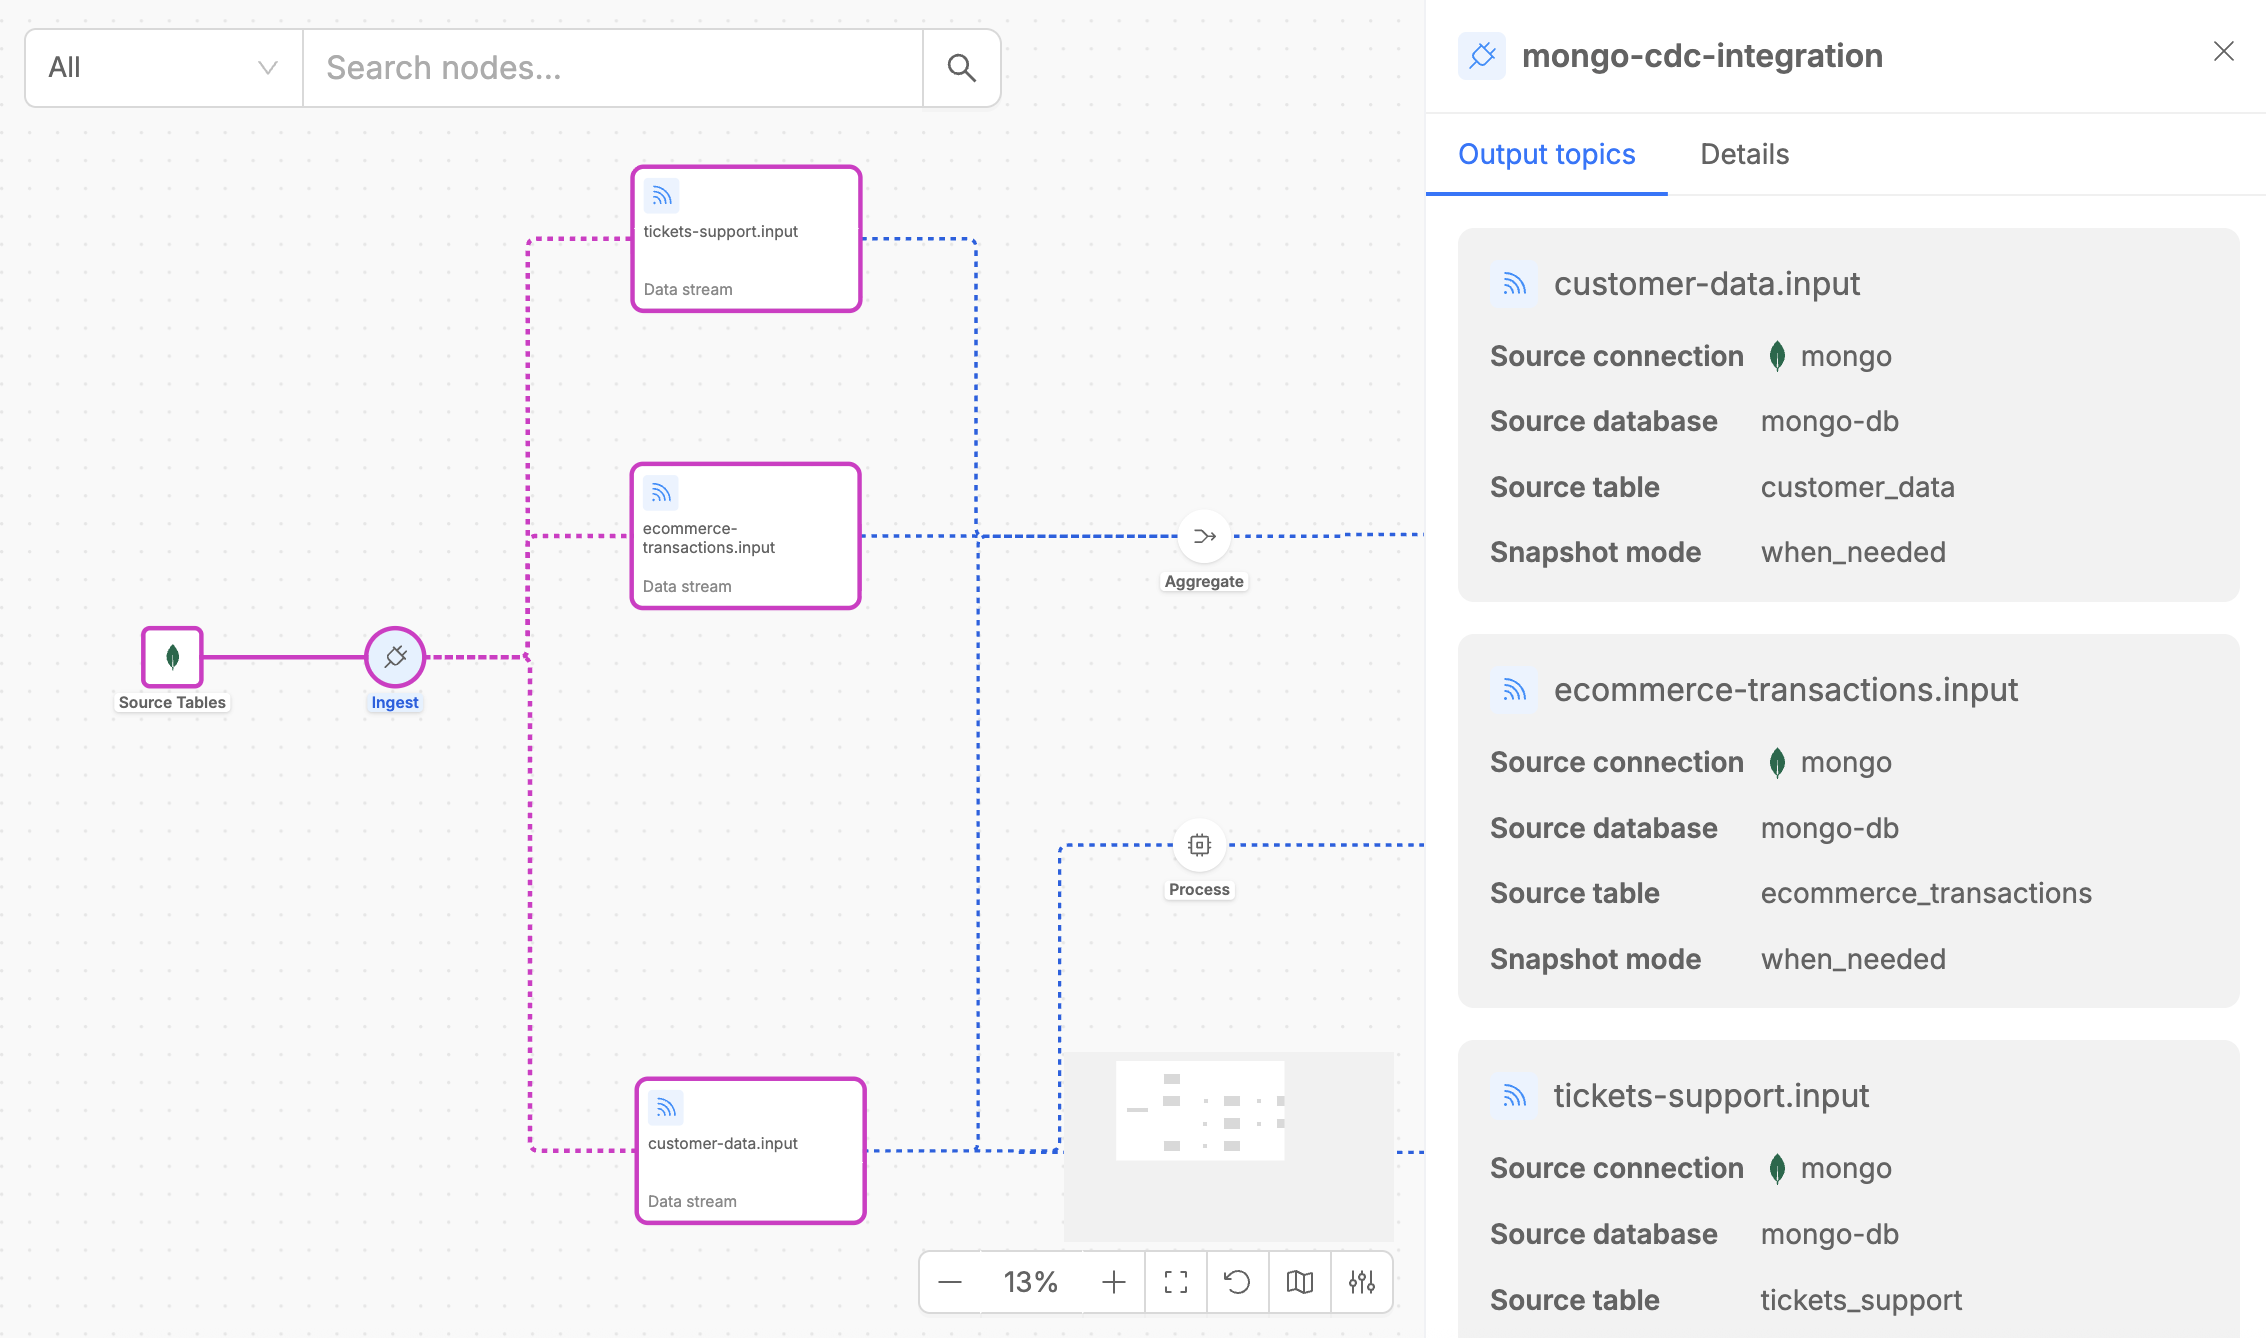
When you click on an Ingest step, the detail panel shows two tabs:
- Output Topics: Lists all Kafka topics where change events are published. Each topic corresponds to a MongoDB collection being monitored for changes.
- Details: Provides useful metadata like the type of the execution step, the version of the microservice that implements the steps and the number of replicas.
Process
The Process step is implemented by Stream Processor, that provides powerful data transformation capabilities.
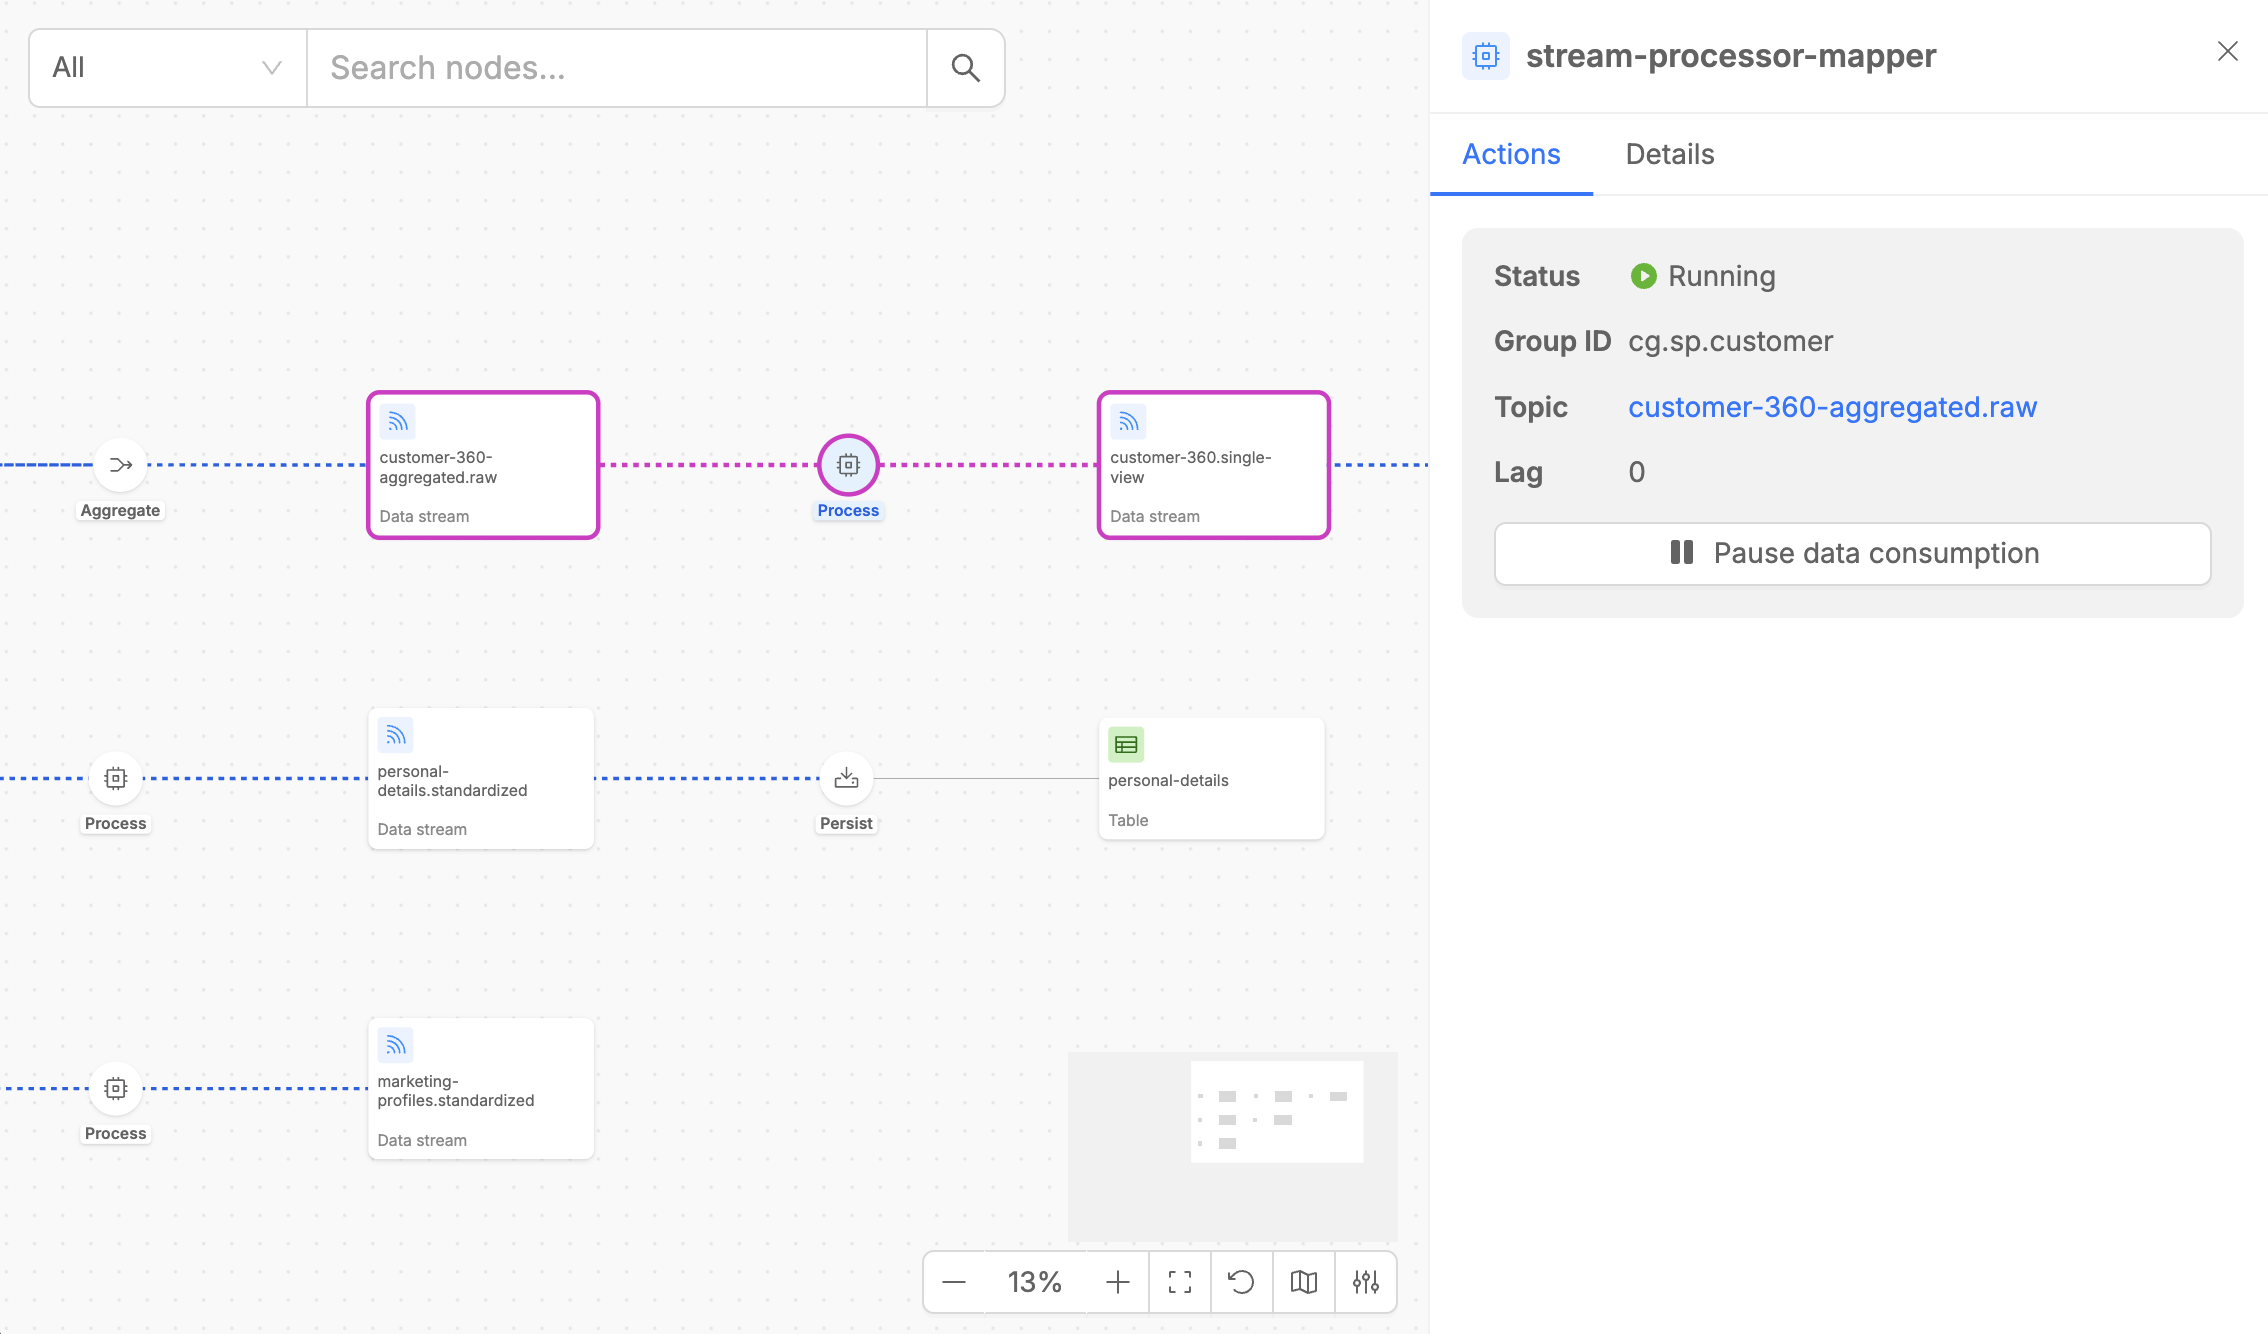
The Process step detail panel contains two tabs:
- Actions: Shows the input stream that the Stream Processor is consuming from, including consumer group information and current lag metrics. For the consumed data stream, it is possible to pause and resume the data consumption with the dedicated button.
- Details: Provides essential metadata, including the execution step type, the processing code that applies custom transformation logics on input data, the microservice version, and the number of replicas, alongside configuration details such as caching settings and other key service parameters.
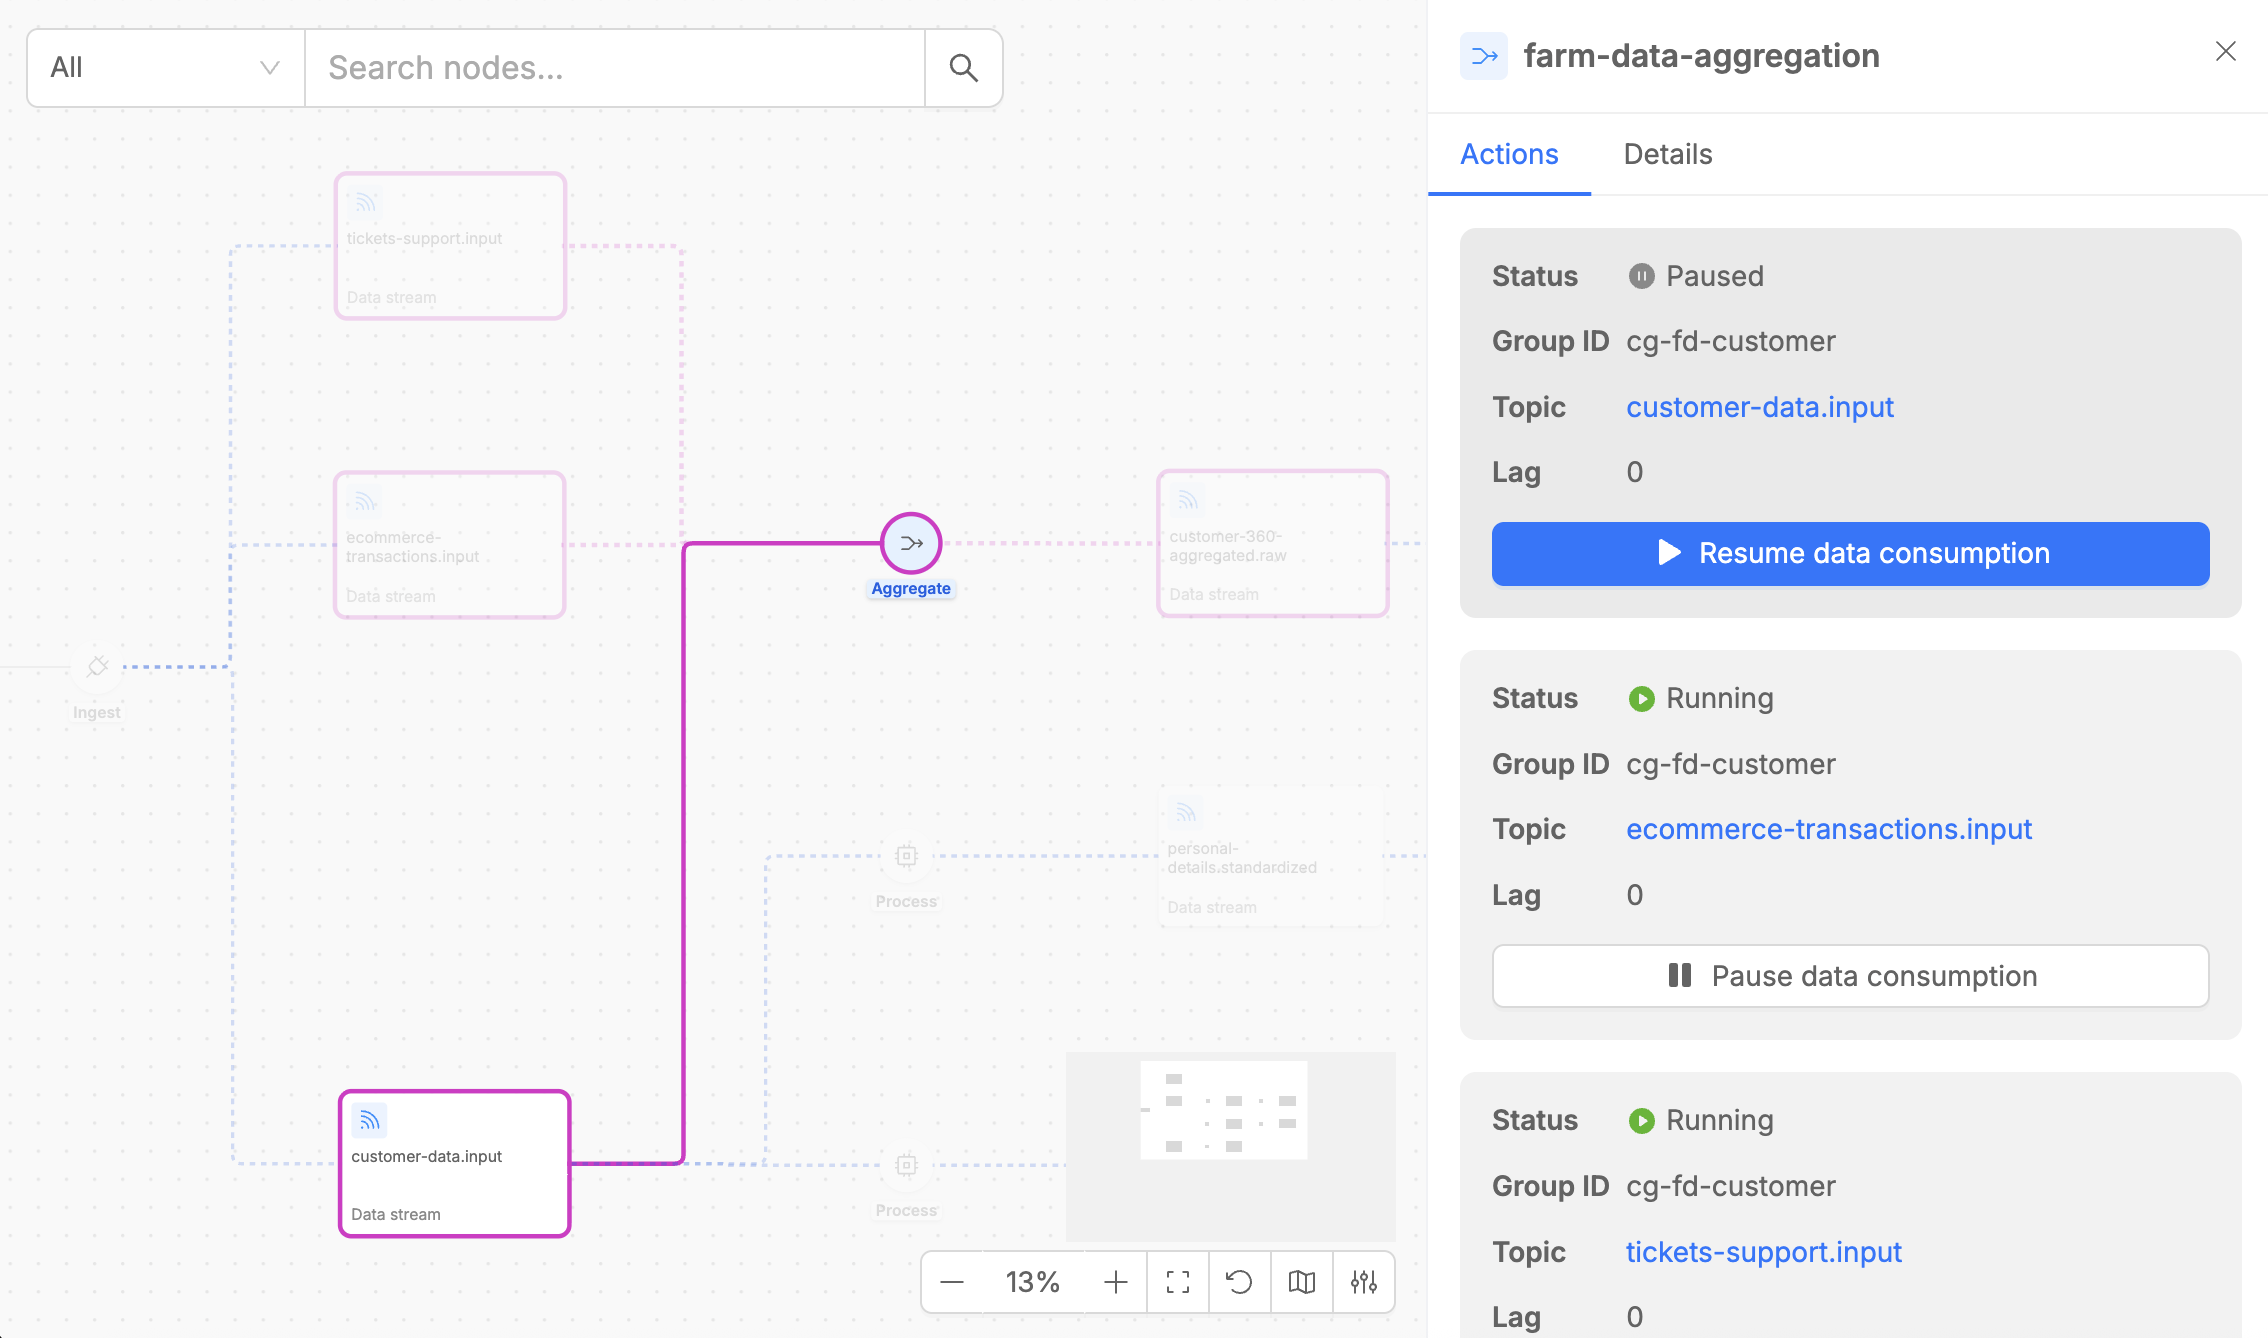
Aggregate
The Aggregate step is implemented by Farm Data and performs real-time multi-stream data aggregation useful to create data products.
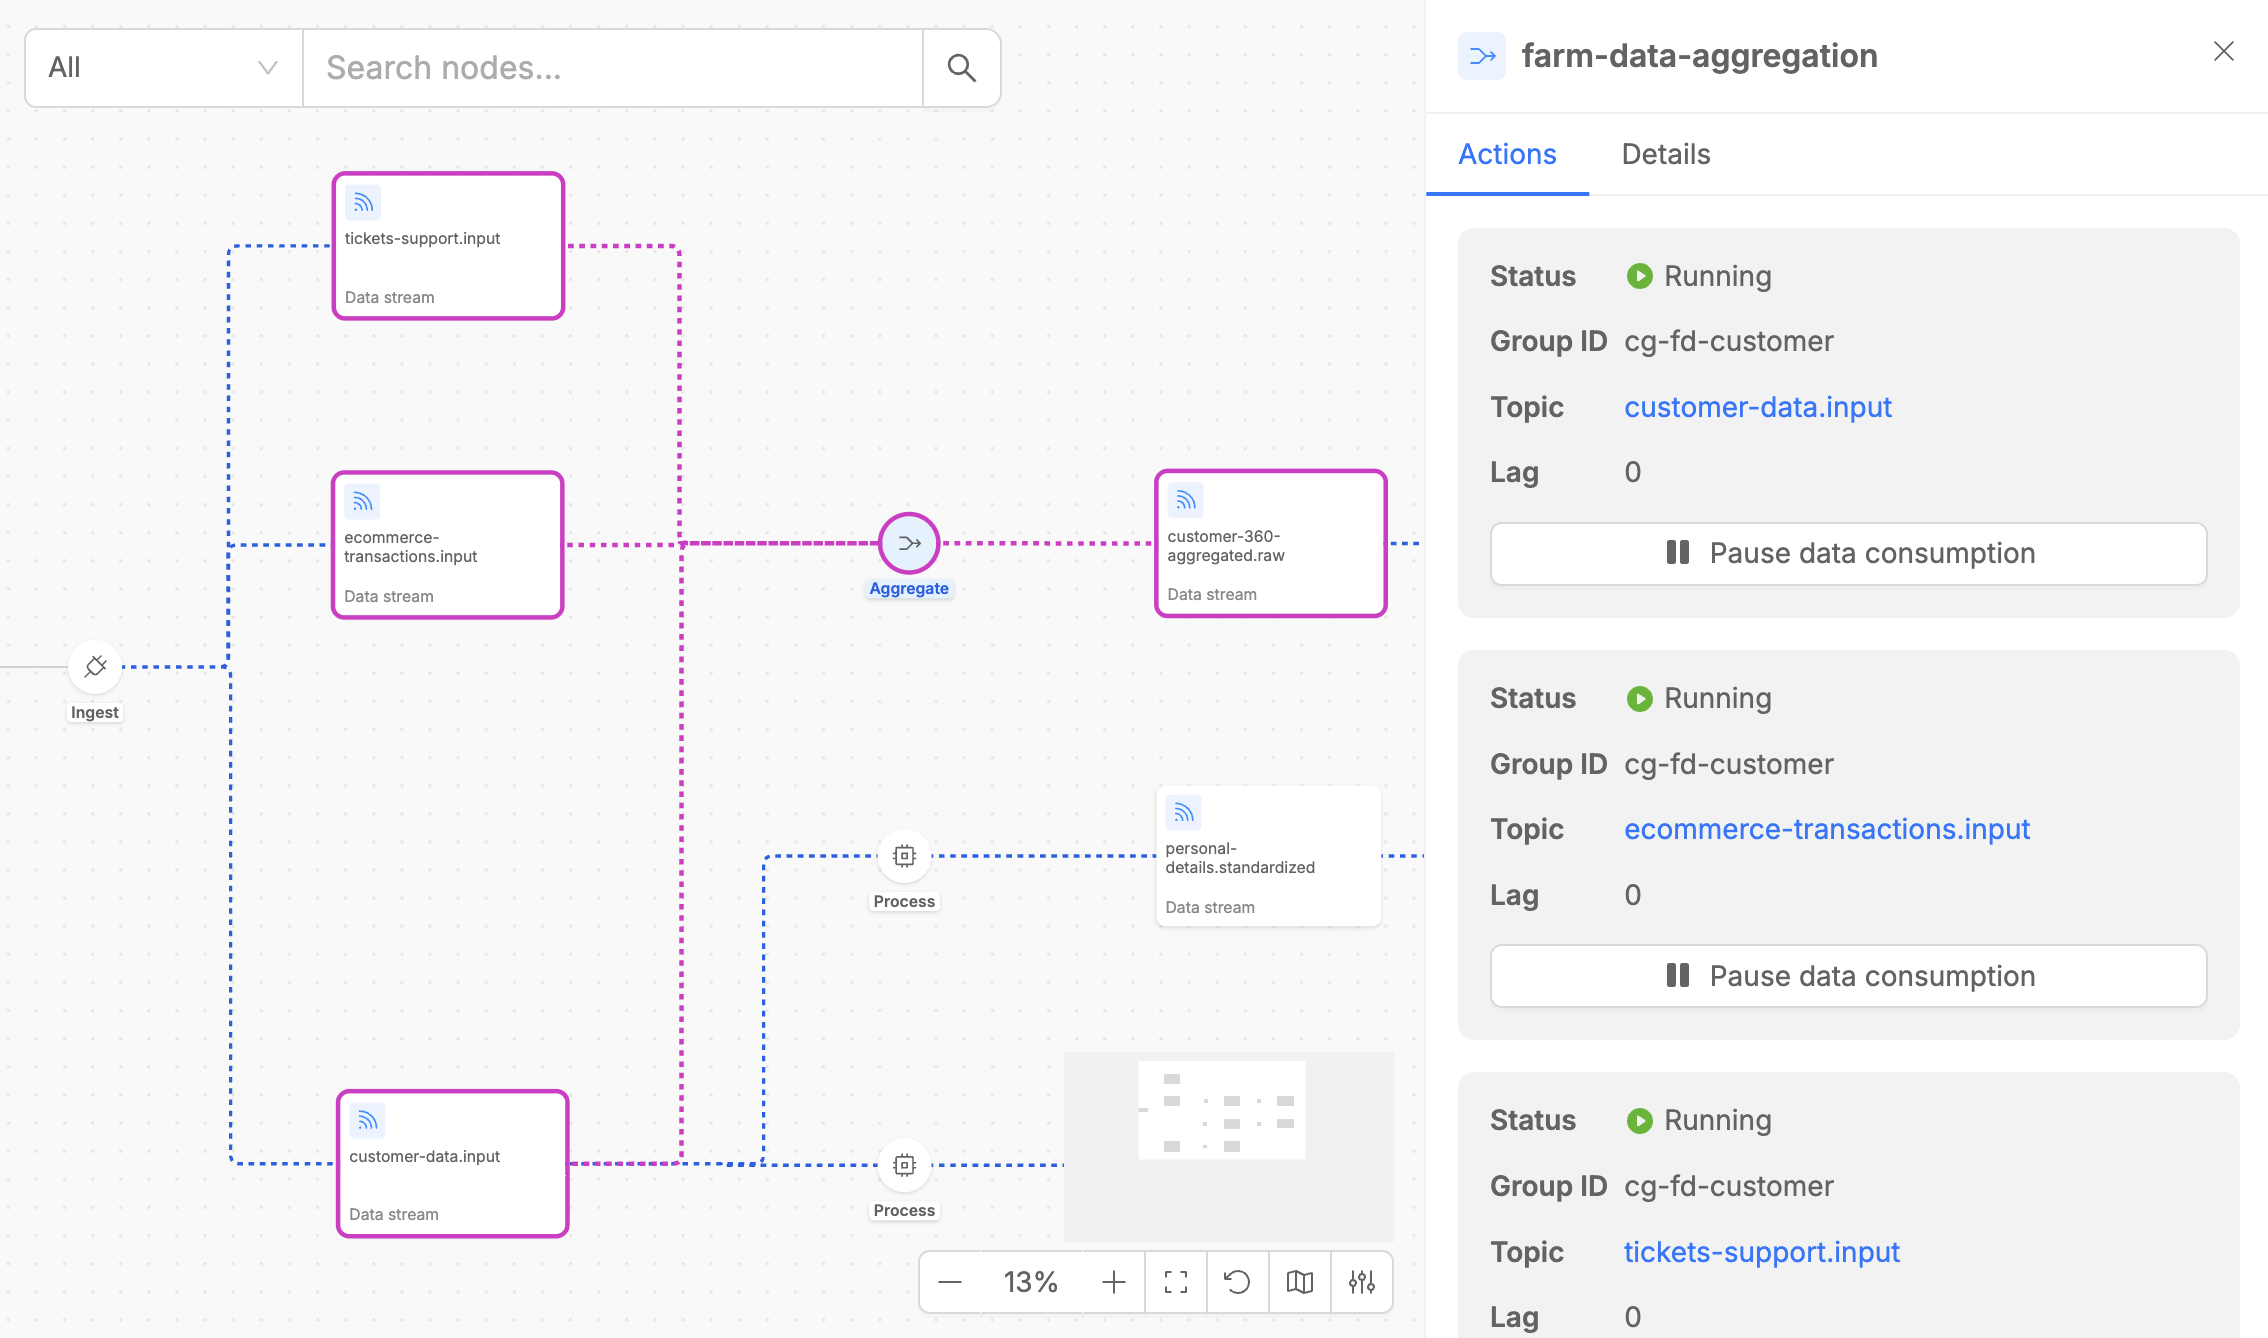
The Aggregate step detail panel contains two tabs:
- Actions: Shows the input streams that the Farm Data is consuming from, including consumer group information and current lag metrics. For each consumed data stream, it is possible to pause and resume the data consumption with the dedicated button.
- Details: Provides essential metadata, including the execution step type, the microservice version, and the number of replicas, alongside configuration details such as caching settings, internal updates topic settings and other key parameters. Moreover, it is possible to access the aggregation graph canvas (see detailed explanation in the next paragraph).
Aggregation Graph Canvas
The Aggregation Graph Canvas is a specialized visual interface within the Aggregate step that displays the entity relationship diagram configured for your aggregation logic. This canvas shows how different data streams are structurally combined to produce the final aggregated output.
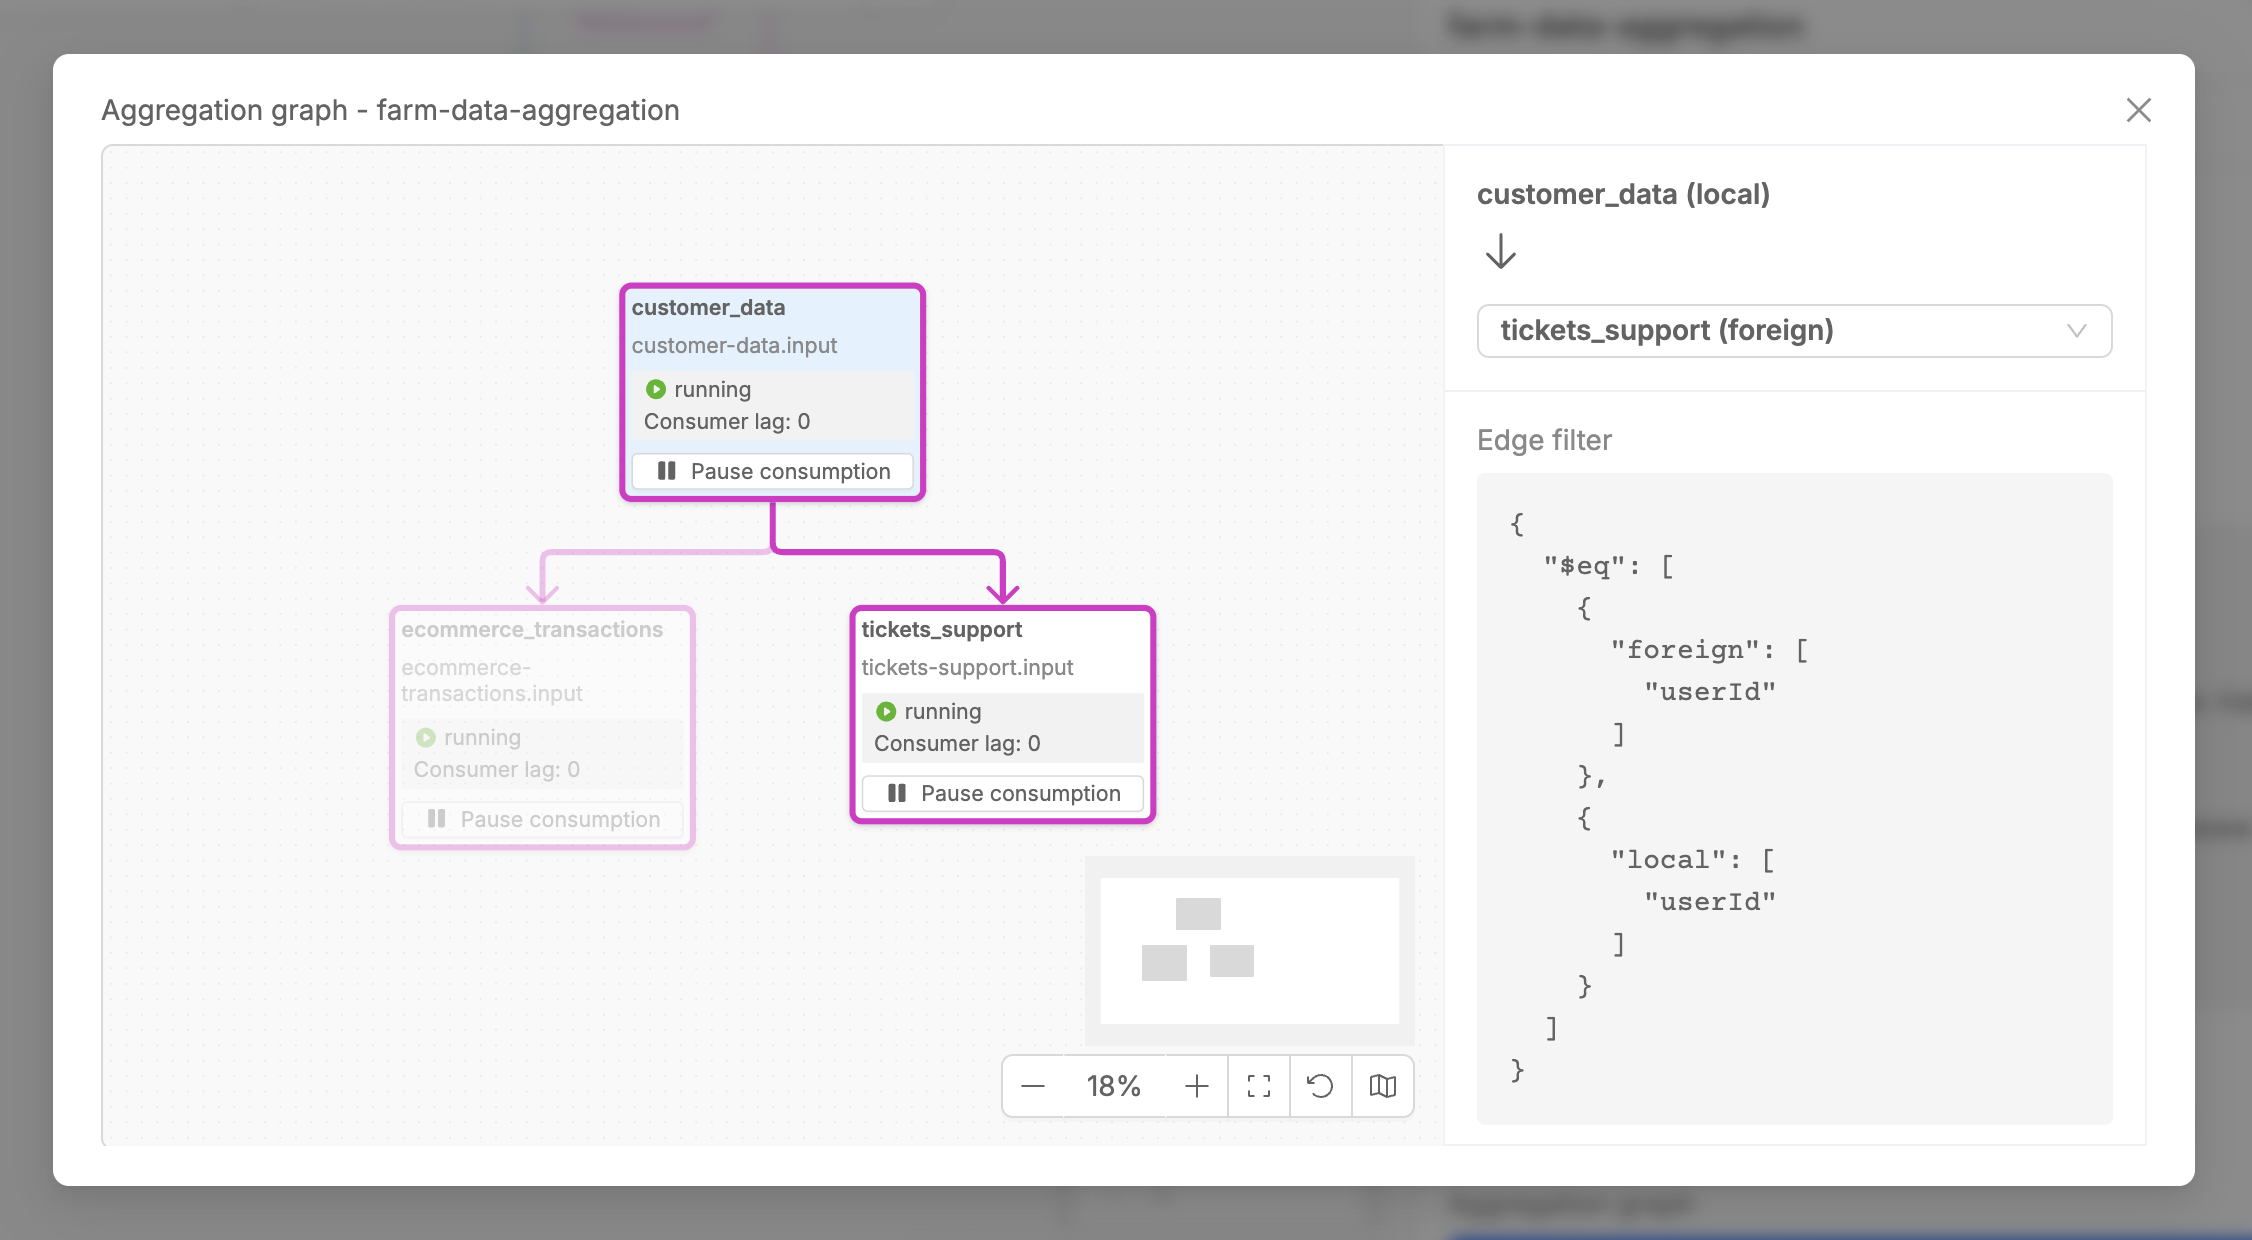
The Aggregation Graph Canvas offers a comprehensive visual representation of entity relationships within the aggregation process, clearly illustrating how different data entities are related with each other to build the final aggregated output. This interface provides detailed information about relationship configurations that define how entities are joined and aggregated together.
The canvas enables interactive exploration of the entire aggregation logic, allowing you to select any two data streams in the graph to examine the specific relationship configuration that governs their interaction, including join conditions and aggregation rules.
Moreover, from the Aggregation Graph Canvas, it is possible to control the runtime state for data consumption from the rendered data streams. For more information on how to control flows, proceed to the following paragraphs.
Persist
The Persist step is implemented by Kango and handles the final storage of processed data from Kafka streams to MongoDB collections (Persisted Assets).
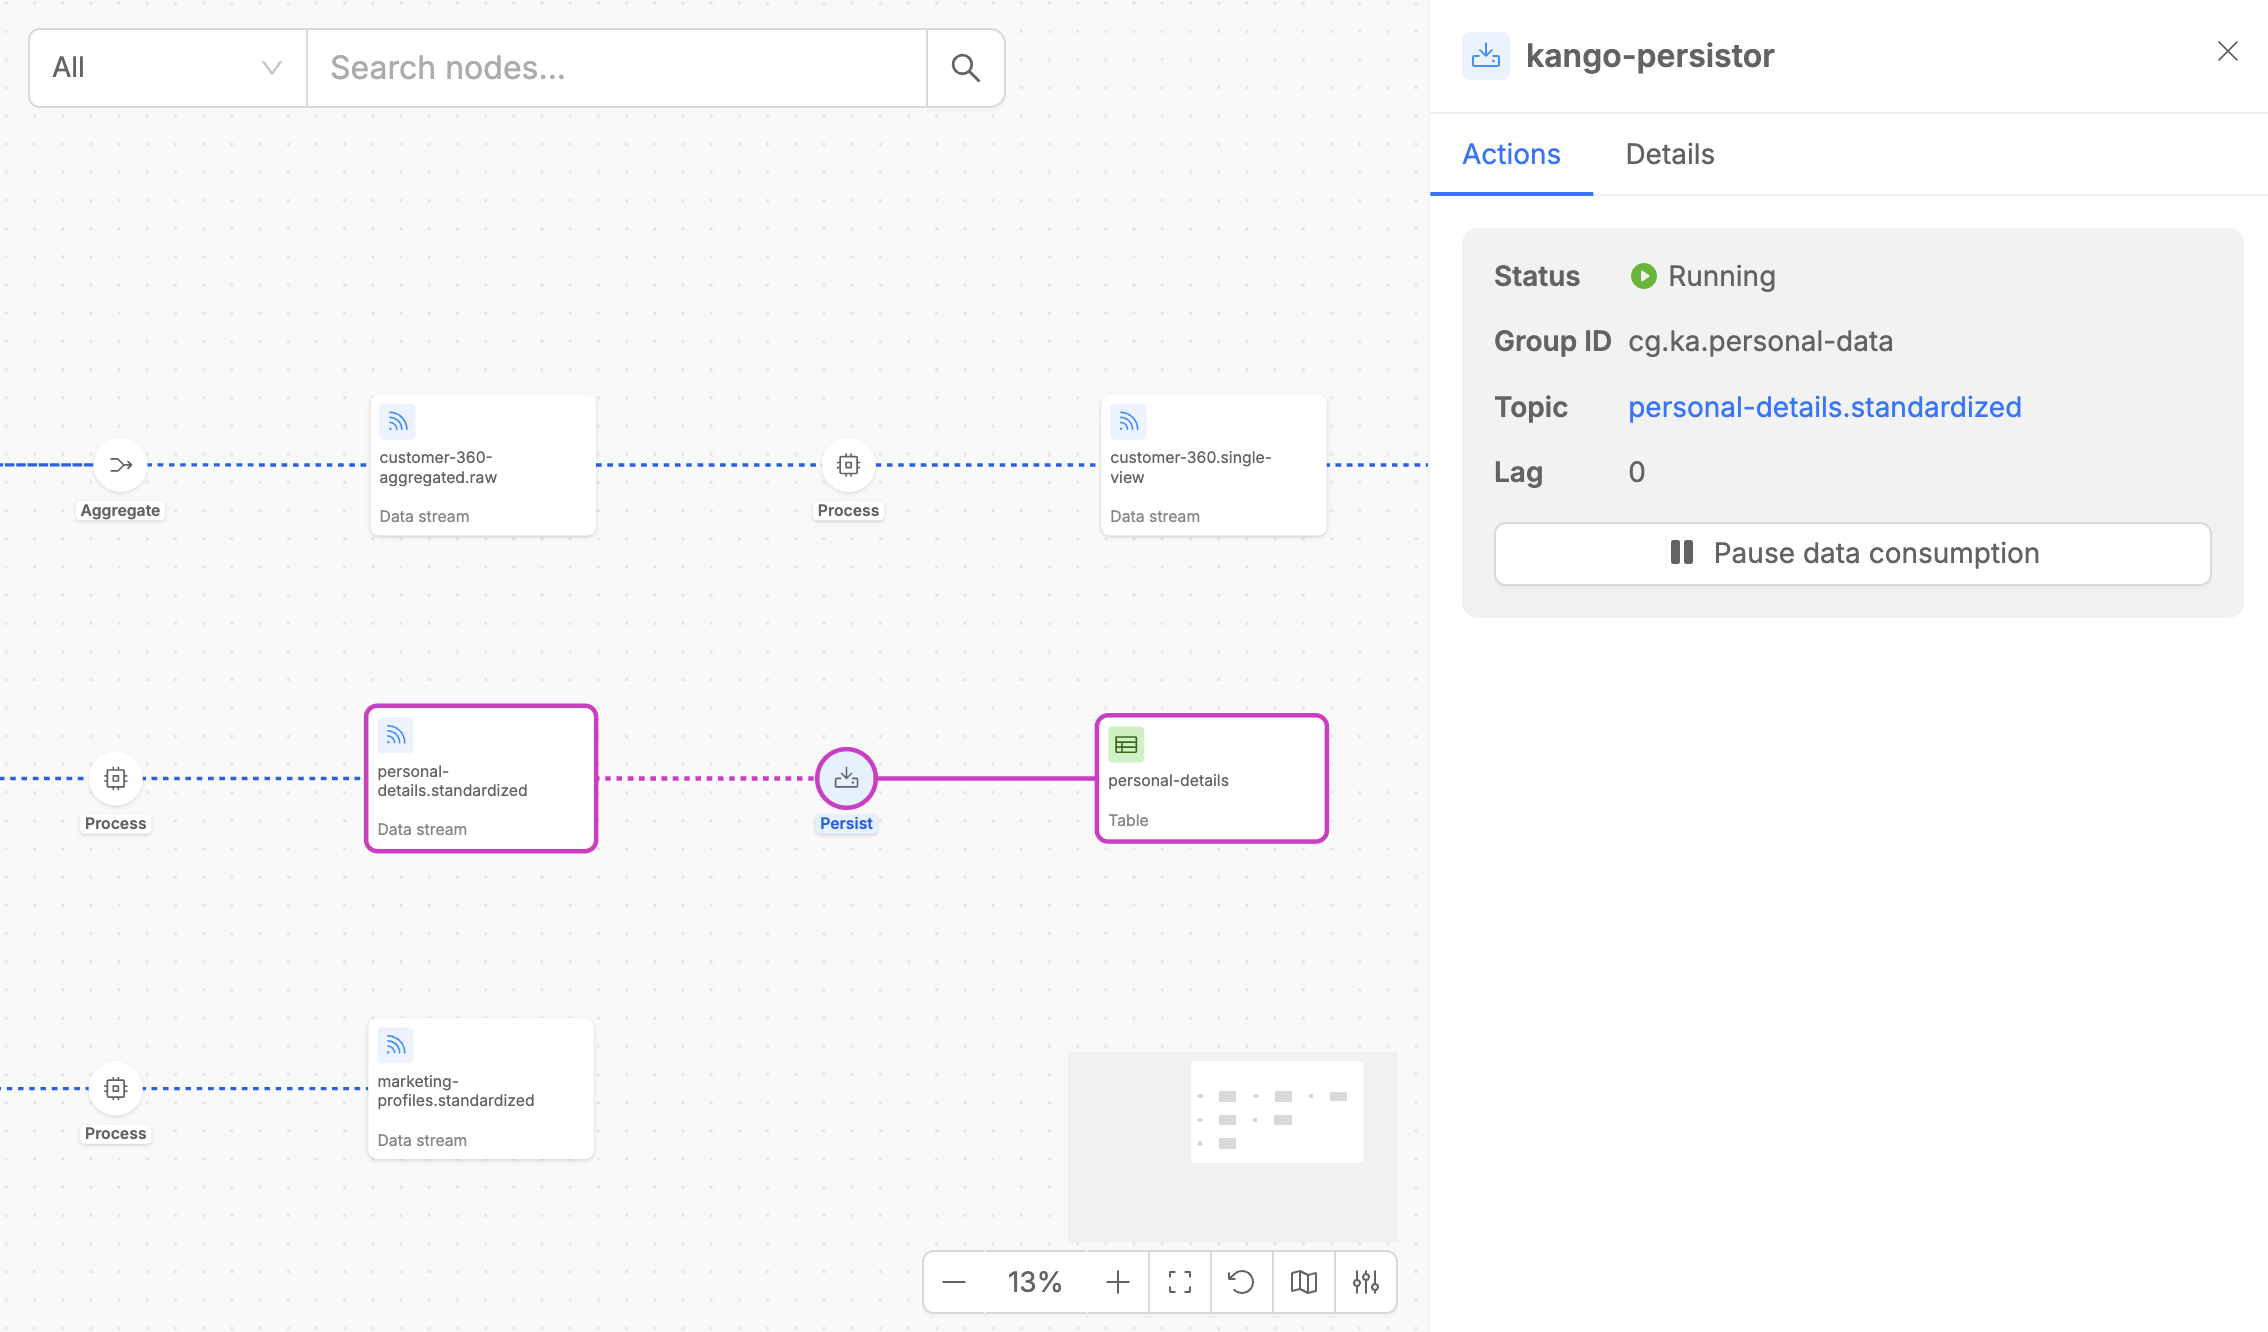
The Persist step detail panel contains two tabs:
- Actions: Shows the input stream that the Stream Processor is consuming from, including consumer group information and current lag metrics. For the consumed data stream, it is possible to pause and resume the data consumption with the dedicated button.
- Details: Provides useful metadata like the type of the execution step, the version of the microservice that implements the steps, the number of replicas and other information including connection name and the target MongoDB collection.
Runtime States
Each execution step in your pipeline can be in one of four distinct runtime states, visually indicated by different colors and indicators in the Control Plane UI.
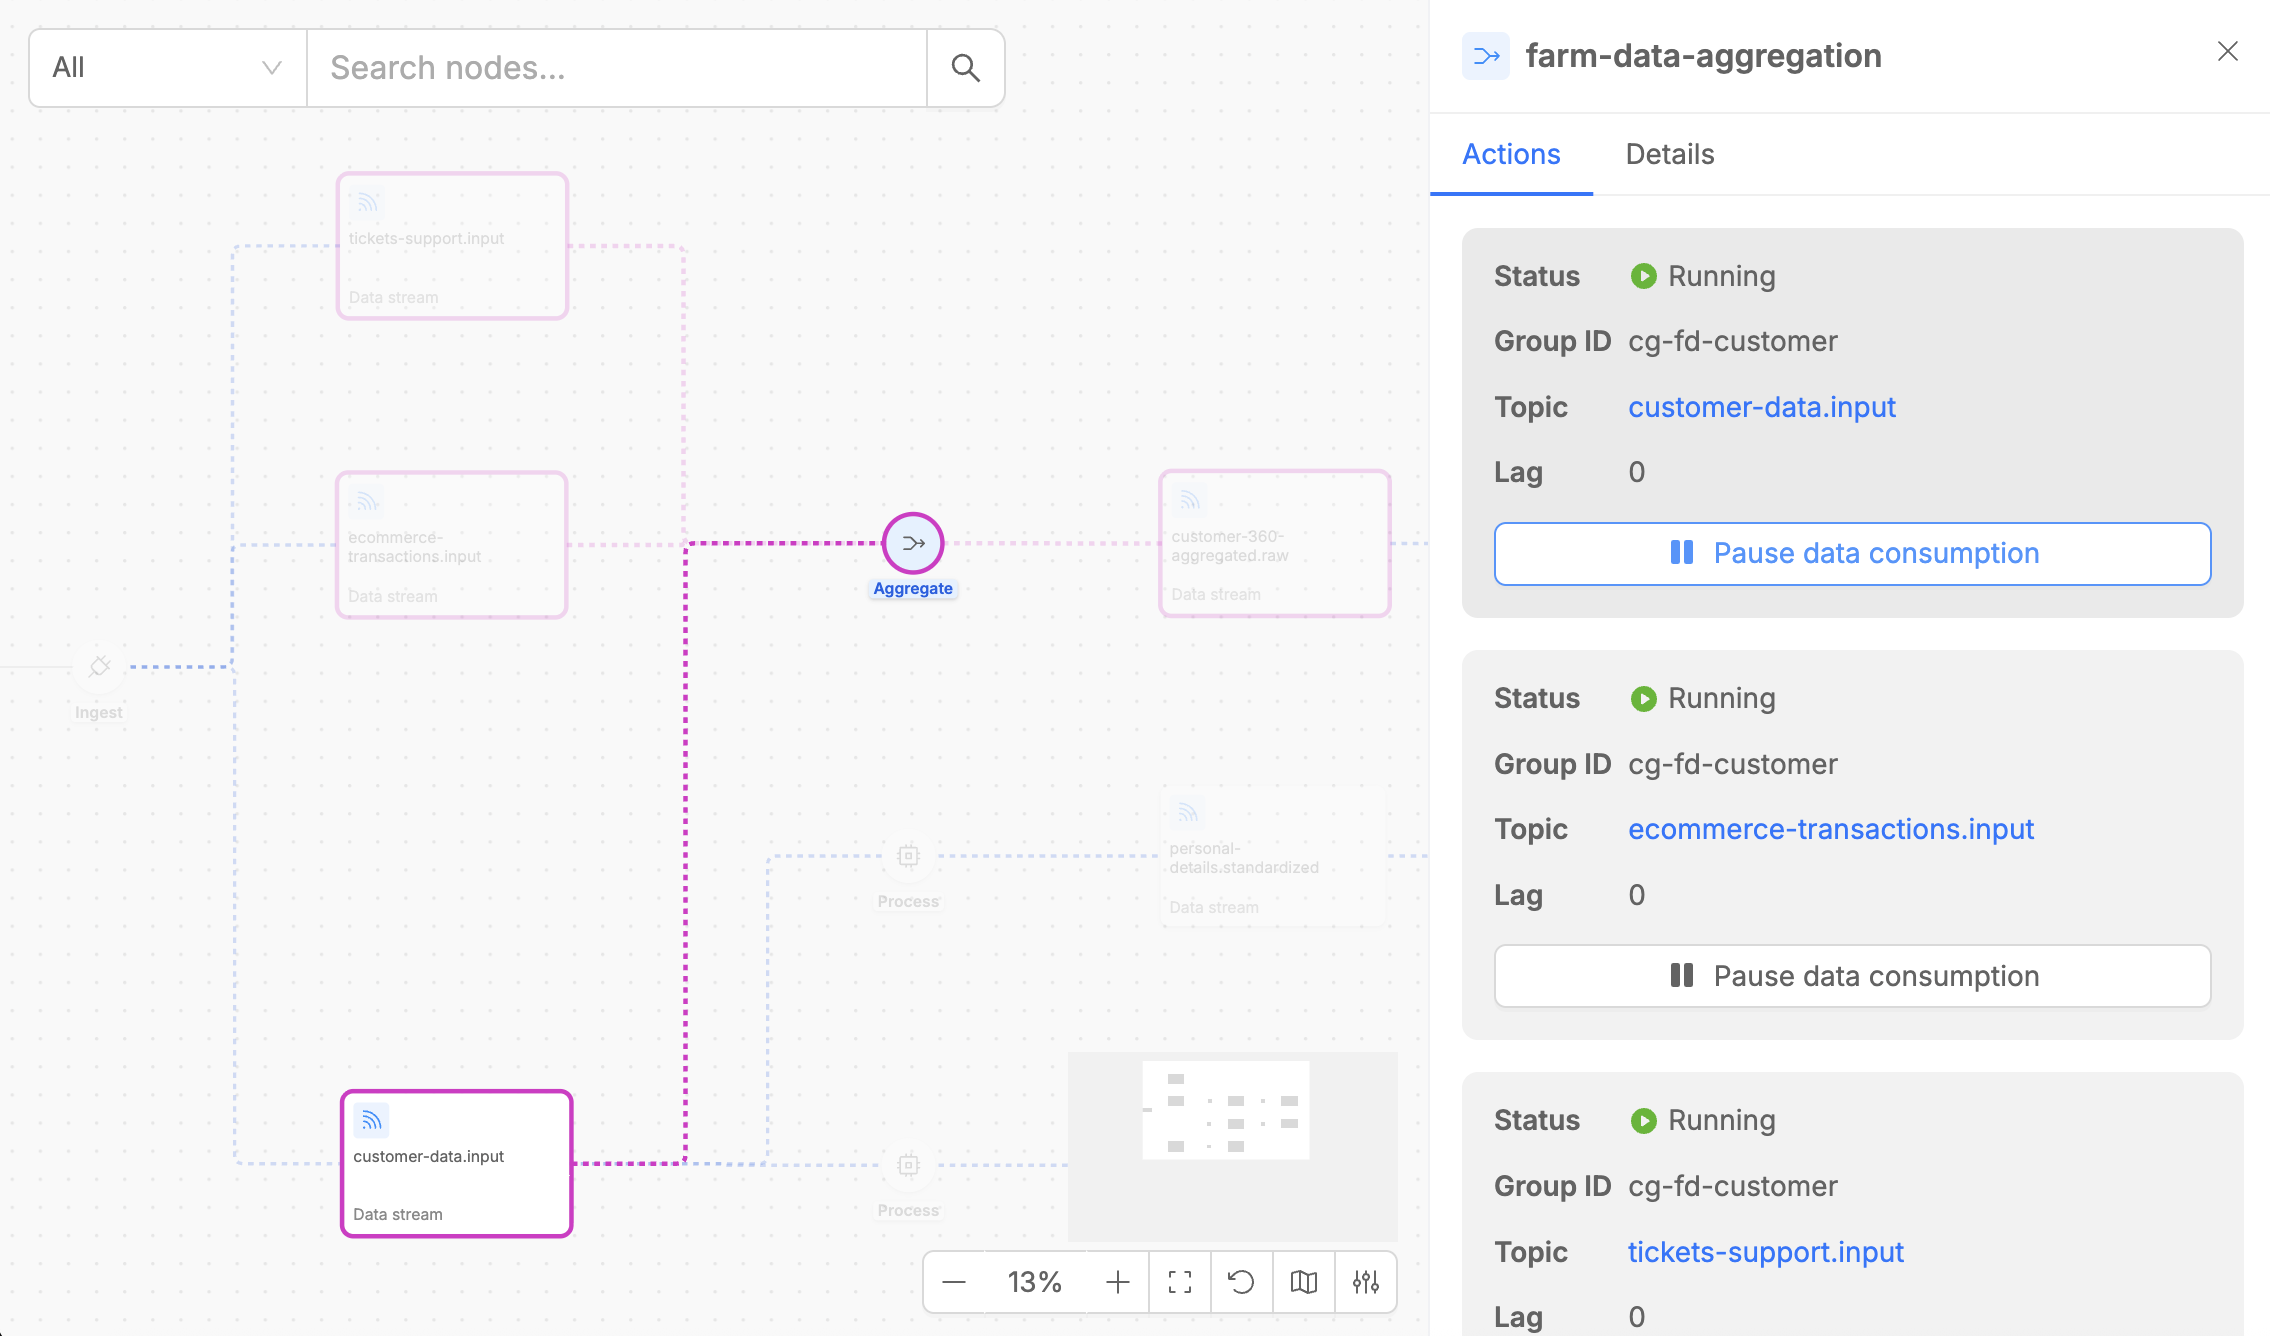
Running
The Running state indicates that the workload's consumer is actively consuming data from the input stream.
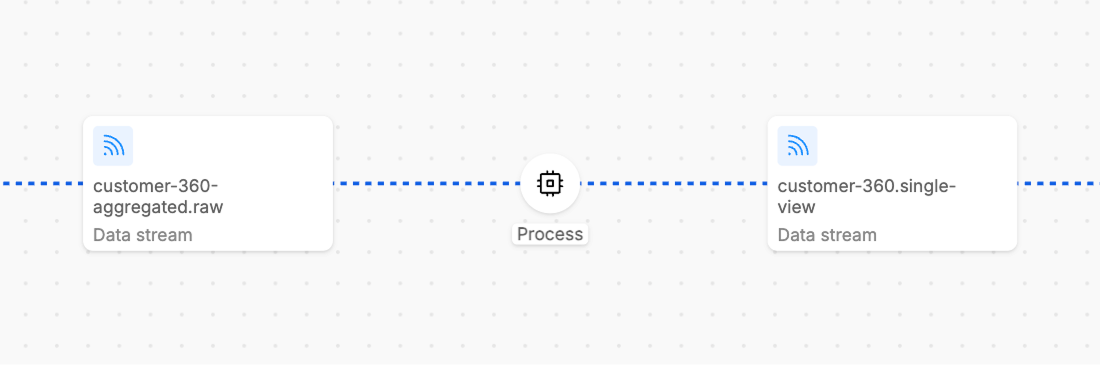
Running steps are indicated by blue dotted line in the UI.
Paused
The Paused state means that the workload's consumer has stopped consuming data from its input streams. This is typically a user-initiated action for maintenance, testing, or controlled processing scenarios.
In Paused state, the workload remains healthy and responsive, no new messages are being consumed from input streams; thus, in case of new input messages, the displayed consumer lag will consequently increase.
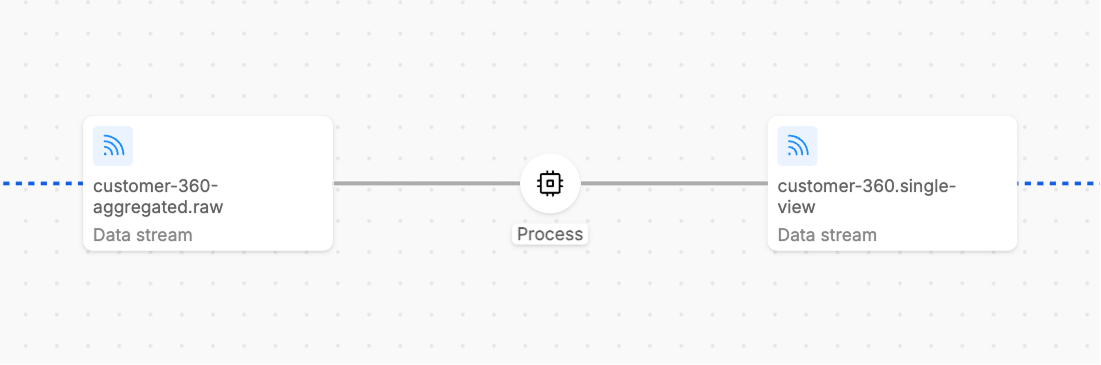
Paused steps are indicated by grey line in the UI.
Unsubscribed
The Unsubscribed state indicates that the workload's consumer is not subscribed to its input streams and therefore cannot consume any data.
This commonly occurs when the consumer group has been unsubscribed from that topic, or when the workload has no replicas running (scaled down completely).
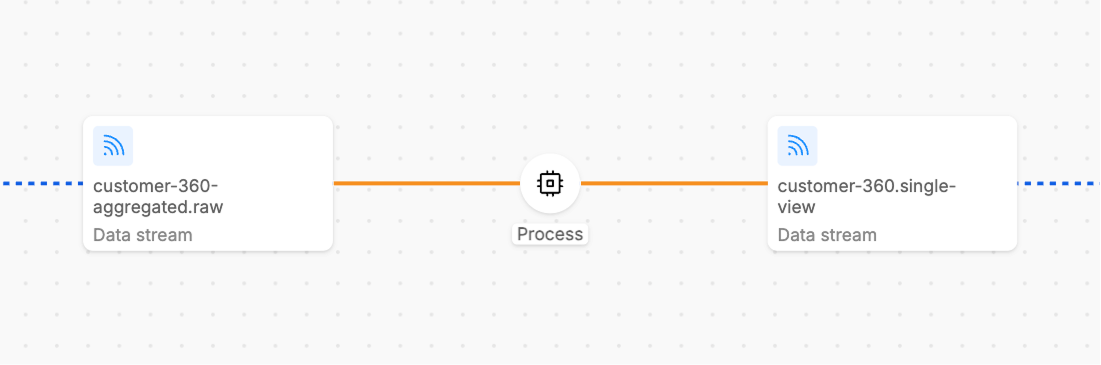
In this state, the consumer cannot process any data and it is no more possible to interact with resume/Pause button and to know about consumer lag info.
Unsubscribed steps are typically indicated by orange line in the UI.
Unknown
The Unknown state indicates that the Control Plane cannot determine the current state of the workload. This typically happens when the service is not reachable or responsive, the workload has crashed or encountered fatal errors, network issues prevent state communication, the service is in an invalid or corrupted state.
Unknown states require investigation and usually indicate operational issues that need immediate attention.
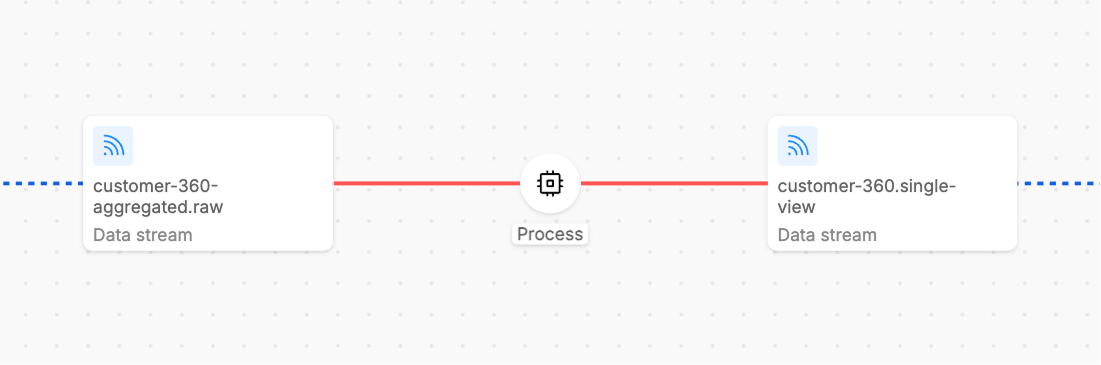
Unknown steps are indicated by red line in the UI.
Control Runtime States
The Control Plane UI provides powerful controls for managing the runtime state of your Fast Data pipeline steps, enabling sophisticated operational strategies for data processing.
The pipeline provides Pause Data Consumption and Resume Data Consumption buttons along the pipeline flows which allow you to pause and resume data consumption from the data stream.
- Pause Data Consumption: Stops the consumer from processing new messages while maintaining stream position
- Resume Data Consumption: Restarts data consumption from the previously maintained position
Pause and Resume buttons are available whenever you click on a pipeline step that supports runtime state control for specific data flows.
Additionally, for the Aggregate execution step, these same controls are also available directly within the Aggregation Graph Canvas, providing enhanced utility for managing Initial Load and Full Refresh scenarios, allowing for more efficient and optimized runtime control in these and other operational scenarios.
For more detailed operational strategies and best practices on using these runtime controls effectively, visit the Best Practices documentation.
Navigating UI
The Control Plane UI provides several features to help you efficiently navigate and interact with your pipeline visualization.
Search elements on the canvas
The search feature enables you to quickly locate specific elements within your pipeline.
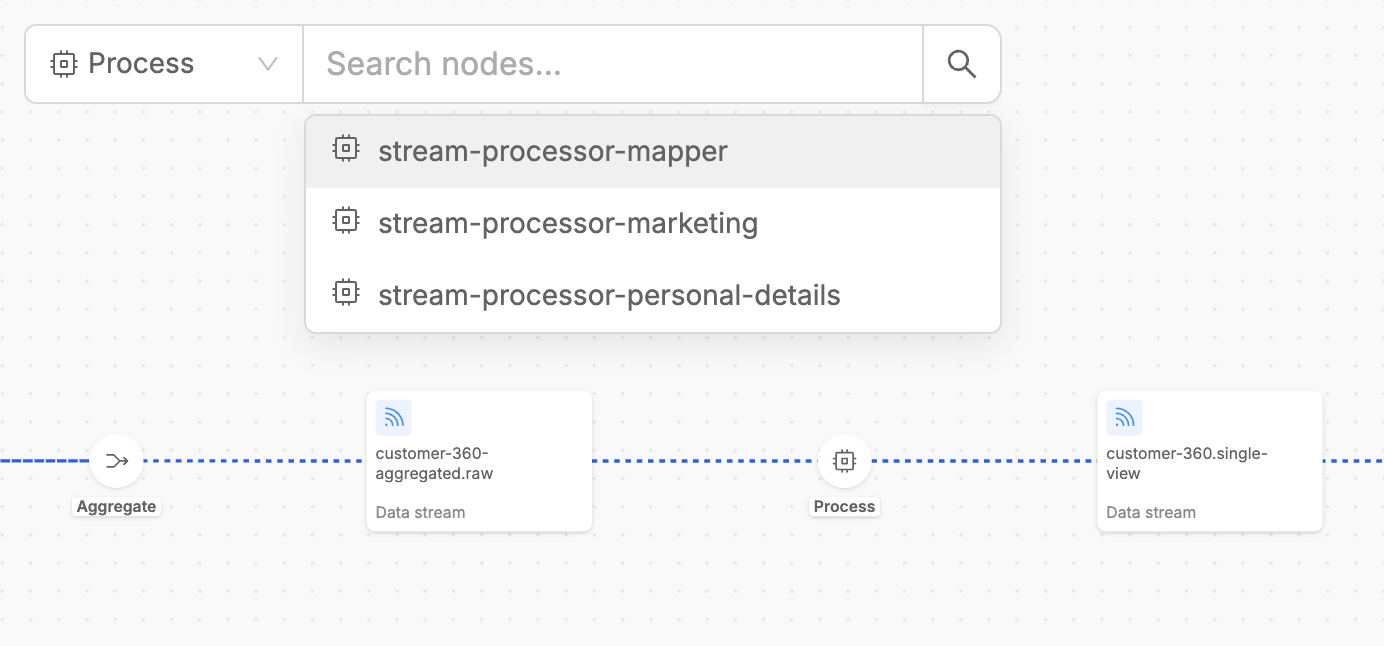
Simply type on the searchbar the name of an artifact or Fast Data workload and select it. The interface will instantly focus on and highlight the selected element, automatically opening the contextual drawer to display all relevant information about it.
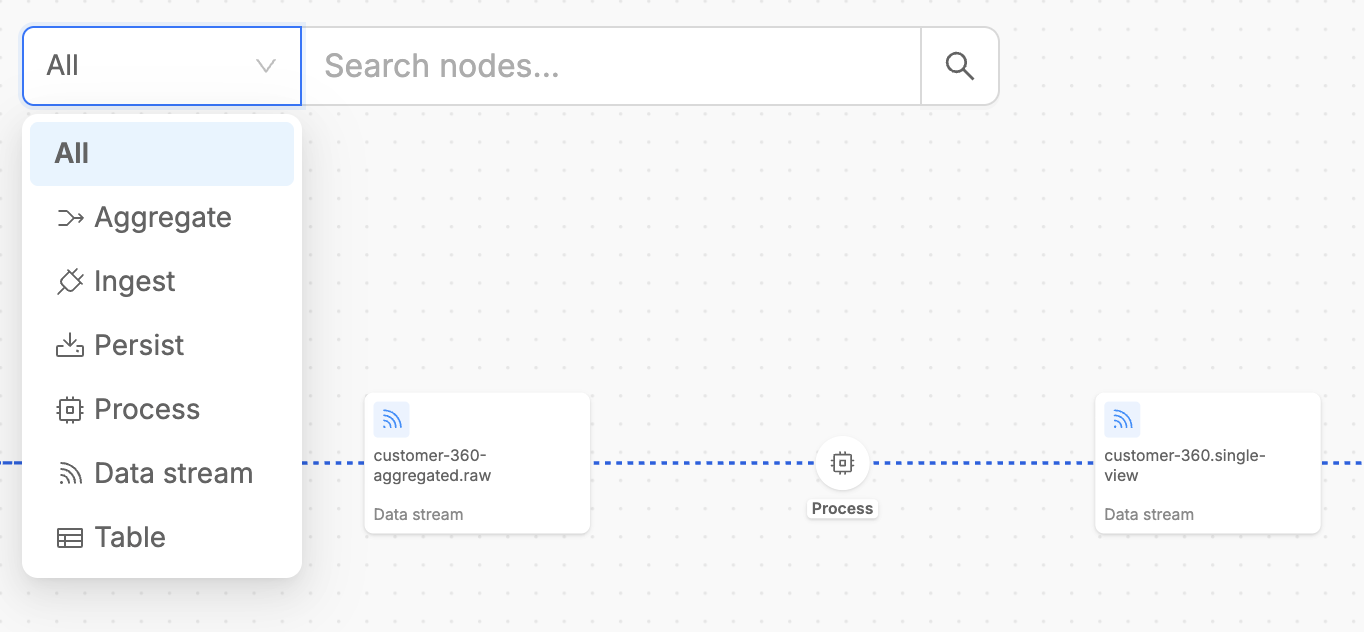
To refine the search scope even more, it is also possible to narrow the context of displayed choices by selecting one asset type on the searchbar.
Highlight on Hover
Typically, when you hover over elements listed in the detail panels or drawers, the corresponding involved pipeline elements are instantly highlighted inside the canvas.
This highlighting feature significantly improves navigation efficiency, especially in complex pipelines with many interconnected components.