Overview
A great way of monitoring Fast Data is using Dashboards, which can give you immediate feedback on various aspects of system health. We provide some already configured Grafana Dashboards to quickly set up a monitoring stack that grants both Dashboards and Alerts.
Console Setup
The Grafana Dashboards make use of Prometheus metrics, which means that you should enable the monitoring of your project (for example, using Prometheus Operator) and export the metrics of interest.
If you are planning to use Prometheus Operator as a monitoring system for your project, you can automatically generate and configure the servicemonitor.yml files for all the monitoring services using their Metrics card.
Metrics
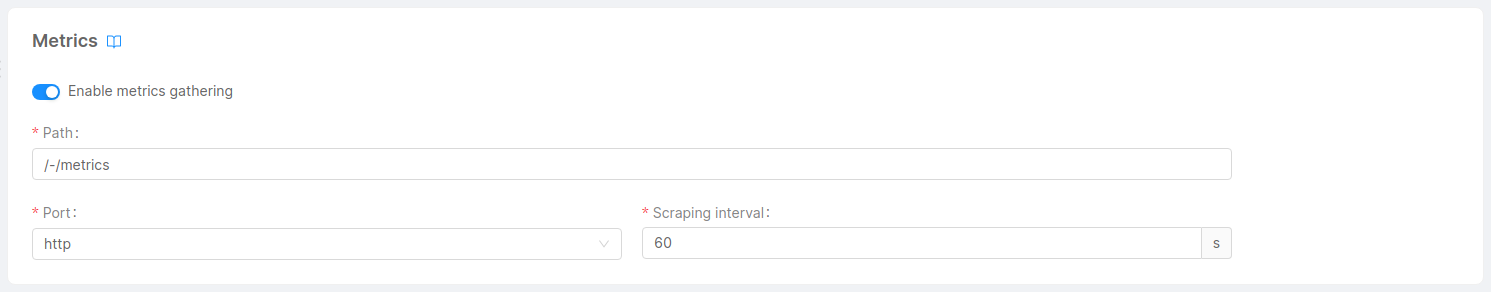
Metrics are a set of categorized data generally exposed through a /-/metrics http GET route which reveals all the Prometheus metrics exposed by each service.
Fast Data services metrics
Each Fast Data service comes with its set of metrics exposed through an http route. To expose them you only need to enable the Enable metrics gathering switch that you can find in each microservice's page in the console.
MongoDB and Apache Kafka metrics
For the dashboards related to MongoDB and Apache Kafka metrics you will need to setup the Kafka Exporter and MongoDB Query Exporter services. Conveniently, you can create them all at once by going to the Applications section of your console and creating a new Fast Data Monitoring Application.
MongoDB Query Exporter Configuration
The MongoDB Query Exporter service will expose all metrics we define in the config.yml config map. To use the Projection Changes Dashboard you need to make sure that for every Projection Changes collection you have in the console the respective metric is defined.
Here's an example with fd-pc-library and fd-pc-restaurant Projection Changes collections:
...
- name: projection_changes_new_info
  type: counter #Can also be empty, the default is gauge
  servers: [main] #Can also be empty, if empty the metric will be used for every server defined
  help: 'Count the number of NEW projection changes'
  value: total
  labels: []
  mode: pull
  cache: 0
  constLabels:
      collection: fd-pc-library
  database: {{MONGODB_NAME}}
  collection: fd-pc-library
  pipeline: |
    [
      {
          "$match": {
              "changes.state": "NEW"
          }
      },
      {
          "$count": "total"
      },
      {
          "$facet": {
              "count": [
                  { "$project": { "total": 1, "_id": 0 }}
              ]
          }
      },
      {
          "$project": {
              "total": { "$cond": [ { "$gt": [{"$size": "$count"}, 0 ] }, { "$arrayElemAt": ["$count.total", 0]}, 0] }
          }
      }
    ]
- name: projection_changes_new_info
  type: counter #Can also be empty, the default is gauge
  servers: [main] #Can also be empty, if empty the metric will be used for every server defined
  help: 'Count the number of NEW projection changes'
  value: total
  labels: []
  mode: pull
  cache: 0
  constLabels:
      collection: fd-pc-restaurant
  database: {{MONGODB_NAME}}
  collection: fd-pc-restaurant
  pipeline: |
    [
      {
          "$match": {
              "changes.state": "NEW"
          }
      },
      {
          "$count": "total"
      },
      {
          "$facet": {
              "count": [
                  { "$project": { "total": 1, "_id": 0 }}
              ]
          }
      },
      {
          "$project": {
              "total": { "$cond": [ { "$gt": [{"$size": "$count"}, 0 ] }, { "$arrayElemAt": ["$count.total", 0]}, 0] }
          }
      }
    ]
...
Mind that the only thing that changes from one metric to another is the collection property and label, the rest should remain the same like in the example for the Projection Changes dashboard to properly work.
Kafka Exporter Configuration
Kafka exporter service configuration is quite easy, the only thing you need to do is make sure the variables in the Microservice configuration - Args section are properly defined.
Some of the variables are filled from the Public variables section:
KAFKA_SASL_USERNAME="username"
KAFKA_SASL_PASSWORD="password"
KAFKA_SASL_MECHANISM="scram-sha256" # Mind there's no `-` between `sha` and `256`
KAFKA_EXPORTER_TOPIC_FILTER="my.topics.prefix.*"
KAFKA_EXPORTER_GROUP_FILTER="my.consumer.groups.prefix.*"
For the Kafka brokers definition, you have to define each of them separately by the usage
of the kafka.server flag, so that the arguments of the microservice would look as follows:
--kafka.server=<your first kafka broker>
--kafka.server=<your second kafka broker>
// ... other kafka brokers
--sasl.enabled
--sasl.username={{KAFKA_SASL_USERNAME}}
--sasl.password={{KAFKA_SASL_PASSWORD}}"
--sasl.mechanism={{KAFKA_SASL_MECHANISM}}
--tls.insecure-skip-tls-verify
Dashboards
You can create any custom dashboards using the metrics provided by the Fast Data services as well as the MongoDB Query Exporter and Kafka Exporter services. But if you're looking for a quicker start, we have a set of pre-configured dashboards designed to make the monitoring setup easier for you.