Playbook Sessions
The Playbook Sessions page gives you real-time visibility into how your agents and playbooks are performing in production. It surfaces aggregate usage statistics, charts, and a searchable session list, making it easier to diagnose problems, monitor costs, and understand usage patterns across your AI workloads.
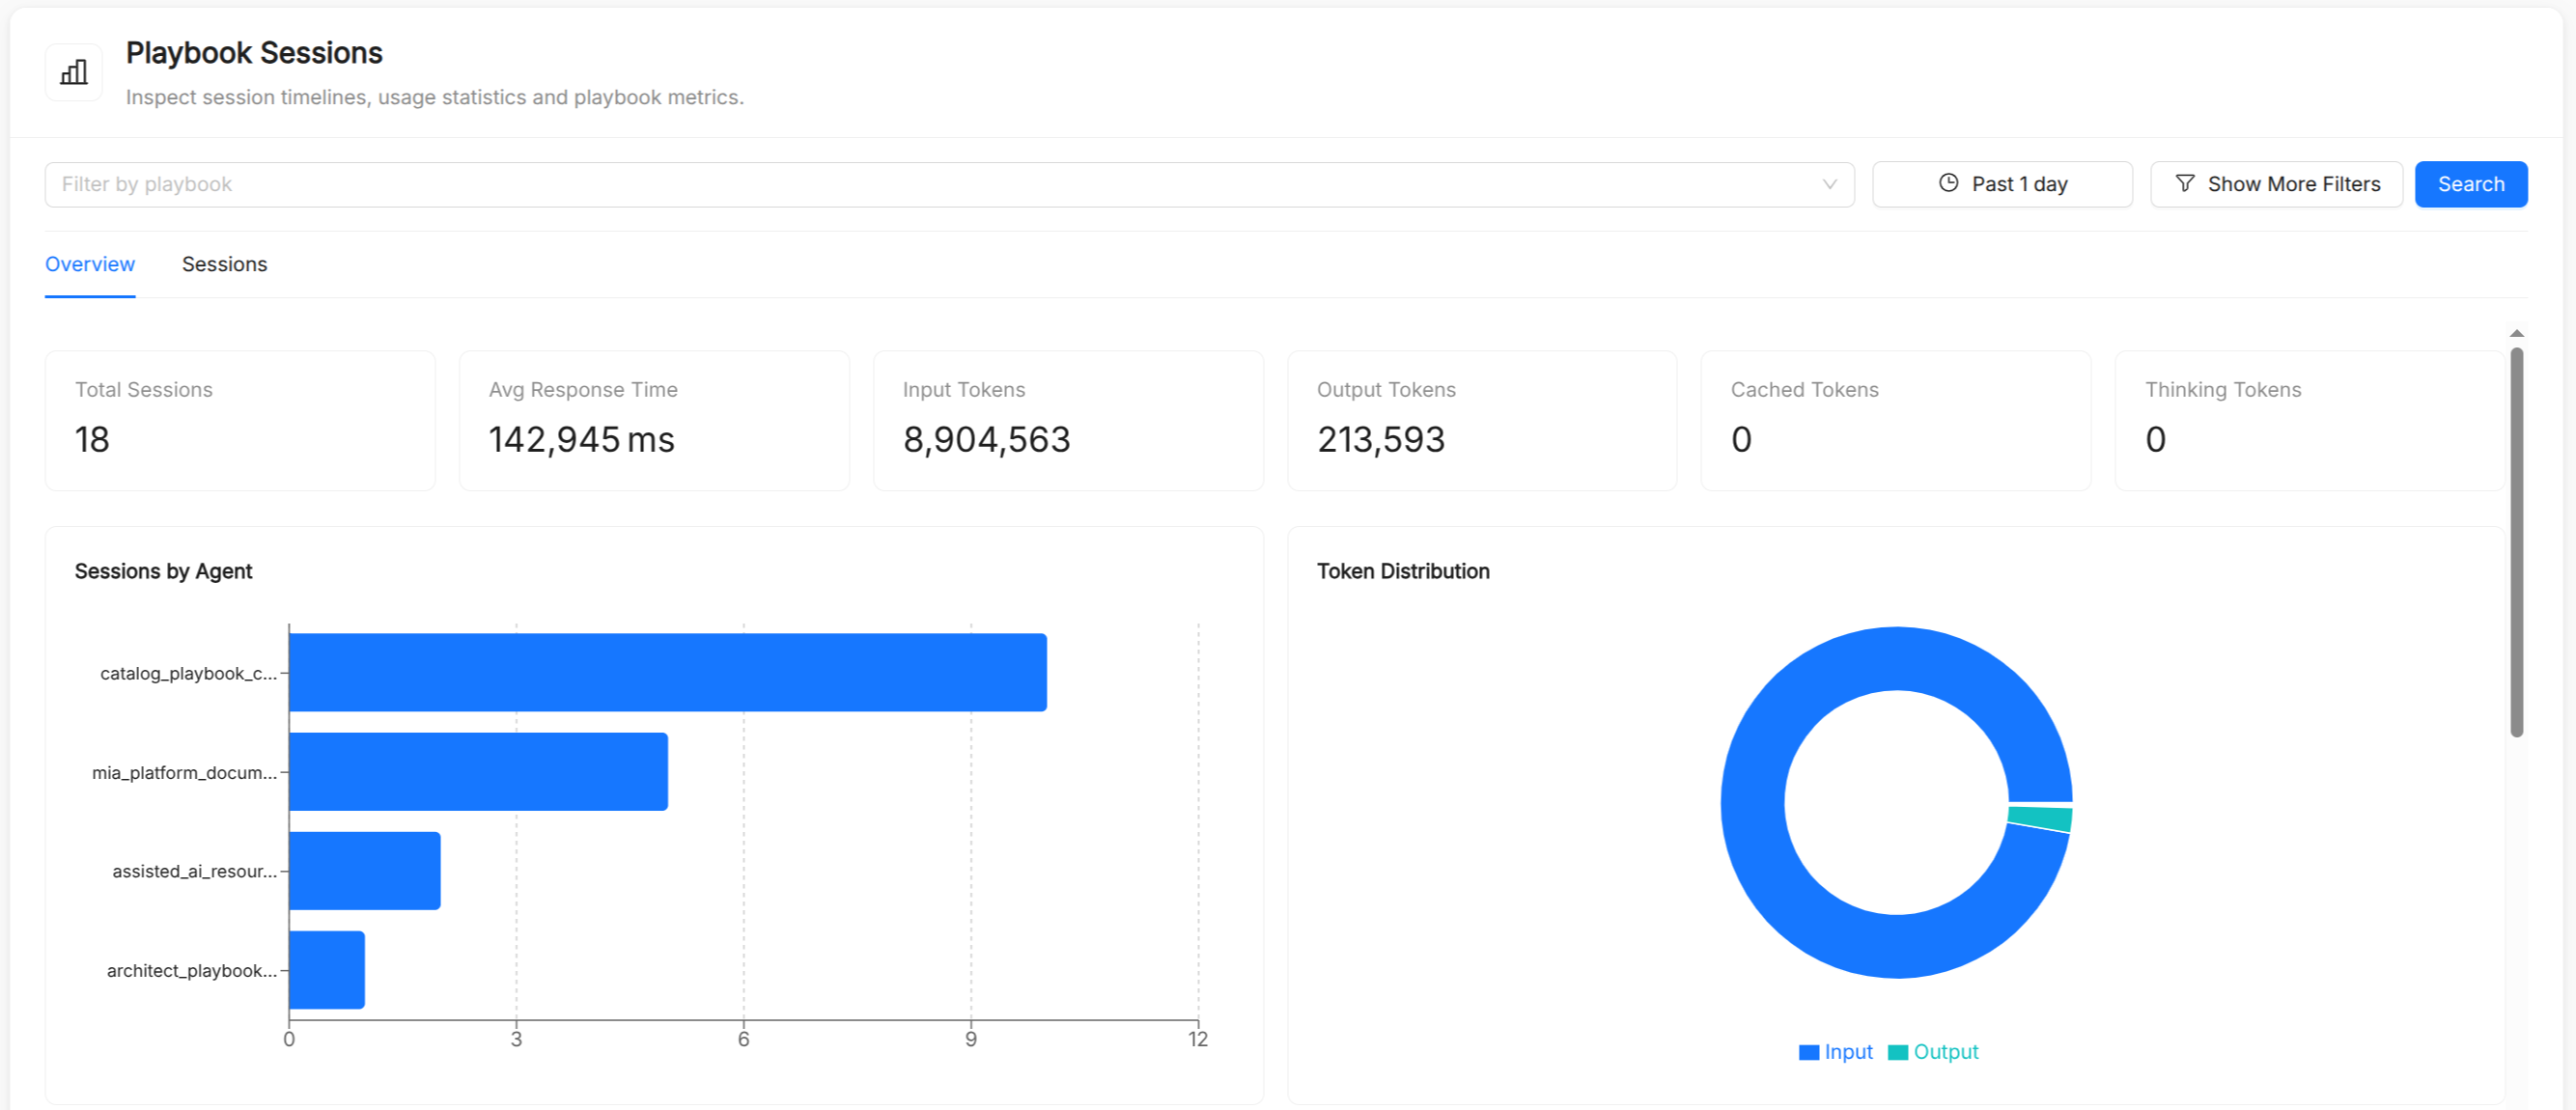
The page is split into two tabs:
- Overview (aggregate metrics and charts)
- Sessions (a searchable log of individual sessions).
Filter bar

All views on the Playbook Sessions page are driven by a shared filter bar at the top:
| Filter | Description |
|---|---|
| Playbook | Multi-select one or more playbooks to narrow metrics and the session list to their activity. |
| User ID | Optionally enter a user ID to filter sessions belonging to a specific end user. |
| Model | Multi-select one or more LLM models to filter sessions down to those that used them. |
| Date range | Pick a start and end date. Metrics and charts update to cover only the selected time window. |
Advanced filters
An Advanced filters panel adds min/max range filters on:
- Events: narrow the list to sessions with an unusually low or high number of events.
- Total tokens: narrow the list to unusually lightweight or token-heavy sessions.
- Duration (ms): narrow the list to unusually fast or slow sessions.
Overview tab
The Overview tab shows aggregate statistics and time-series charts for the selected filter scope.
Statistics cards
Six summary cards appear at the top of the Overview:
| Metric | Description |
|---|---|
| Total Sessions | Number of agent sessions recorded in the selected window. |
| Avg Response Time | Mean end-to-end response latency in milliseconds. |
| Input Tokens | Total tokens sent to LLM providers (prompt + context). |
| Output Tokens | Total tokens generated by LLM providers. |
| Cached Tokens | Tokens served from the provider's prompt cache (reduces cost). |
| Thinking Tokens | Tokens consumed by extended-thinking / reasoning steps (if enabled). |
Charts
Below the cards, a series of charts and tables break down usage across agents, users, models, and tools for the selected filter scope:
- Sessions by Agent: Bar chart showing how many sessions used each agent.
- Token Distribution: Pie chart breaking down total tokens into input, output, cached, and thinking.
- Token Averages per Session: Summary tiles for average input, output, and (when applicable) thinking tokens per session, plus the cache hit rate.
- User Token Consumption: Bar chart showing total tokens consumed per end user.
- Token Usage by Agent: Bar chart showing total tokens consumed per agent.
- Event Type Breakdown: Pie chart showing the distribution of event types (user message, agent message, tool call, etc.) across all sessions.
- Top Tools by Usage: Bar chart showing the most frequently called tools across all sessions. Only shown when tool-call data is present.
- Playbook latency table: A sortable table of session-duration percentiles (p50, p95, p99) per playbook, for spotting which playbooks are slowest.
- Model Usage: Stacked bar chart showing input, output, and thinking tokens consumed per LLM model.
Trends over time
Below the charts above, three further panels track trends across the selected date range:
- Sessions Over Time: Area chart showing session volume per day/hour.
- Tokens Over Time: Area chart breaking down input, output, cached, and thinking tokens per day/hour.
Sessions tab
The Sessions tab lists every recorded session in a paginated table, with 20 rows per page.
Columns
| Column | Description |
|---|---|
| Agent | The agent (or playbook) that handled the session. |
| Session ID | Truncated session identifier; hover to see the full ID. |
| Session name | Human-readable label for the session (if set by the caller). |
| User ID | The end-user identifier passed at session creation time. |
| Events | Total number of events recorded in the session. |
| Tokens | Compact token summary (↑ input, ↓ output; a "+more" indicator reveals cached/thinking tokens in a tooltip). |
| Duration | Wall-clock duration from the first to the last event. |
| Date | When the session was last updated. |
Opening a session
Click any row to open the Session Detail page for that session, or use the drawer preview to inspect the event timeline without leaving the list.
Session Detail page
The Session Detail page provides a full trace of a single session.
Event timeline
Events are displayed in chronological order. Each event is annotated with:
- Type tag (color-coded): User Message, Agent Message, Tool Call, Tool Response, Handoff, or Other.
- Timestamp: When the event occurred.
- Author: Which agent produced the event (useful for multi-agent flows).
Event content
| Event type | Rendered as |
|---|---|
| User/Agent text | Whitespace-preserved text block. |
| Tool call | Collapsible JSON block showing the function name and arguments. |
| Tool response | Collapsible JSON block showing the function result (or error message). |
| Inline image | Base64-decoded image rendered inline. |
Token usage (input, output, cached, thinking) is shown per event when available from the provider.
See also
- Playbook: multi-step agentic workflows whose sessions are tracked here.
- Agent: the execution unit whose calls are recorded as events.
- AI Traces: low-level distributed tracing across AI Foundry services.
- AI Foundry Overview: platform overview including the AI Playground.