Data Analytics Application
The data analytics application has a focus on the healthcare world of Mia Care.
It provides two dashboards, Users and Services, that can immediately give feedback about the active users of the platform and details about the offered services.
Included Microservices
It’s based on the following services:
-
Charts-service: It is used to assemble dashboards with different charts. For more details, please refer to this documentation. -
Data-visualization: It is required to display dashboards on the Backoffice application. For more details, please refer to this documentation. -
MongoDB-reader: This microservice is used to retrieve the necessary data from mongoDB to feed the different charts. For more details, please refer to this documentation. -
Active User Updater: This service is created specifically for obtaining KPI of active users. It retrieves, at regular intervals, the list of active users from the auth0-client and saves it to the appropriate CRUD. In case the record already exists, the list of users is updated by adding the missing ones.
Moreover, a Backoffice application must already be present in the project, since it is required to view dashboards. For more details, please refer to this documentation.
CRUD Collections
The application creates the following CRUD:
active_users: This crud is created by the application and contains the list of daily active users. It is filled by theActive User Updatermicroservice and it is used to calculate the number of active users.
It also requires the following CRUDs to be already present:
-
users: It contains the information about the user; it requires auserGroupfield to be present. This field indicates the group to which the user belongs and is used to populate almost all graphs in theUsersdashboard. -
appointments: It contains the appointment information; it requires avisitTypeIdfield to be present and the related CRUD containing the visit types. This field is used to populate theAppointments by servicechart. -
reports: It contains the information of various documents; it requires adocumentTypeIdfield to be present and the related CRUD containing the document types. This field is used to populate theNumber of documents by typeschart.
The names of these collections can change according to your project needs. If you want to use different names, please remember to specify them in the following public variables (created by the application): USERS_CRUD, APPOINTMENTS_CRUD, REPORTS_CRUD.
Endpoints
The application also creates the following endpoints:
-
/data-visualization: it exposes thedata-visualization-frontendmicroservice. -
/api/charts/dashboards: it exposes theCharts-servicemicroservice. -
/mongodb-reader: it exposes themondoDB-readermicroservice . -
/active-users: it exposes theactive_usersCRUD collection.
Final Result
Users Dashboard
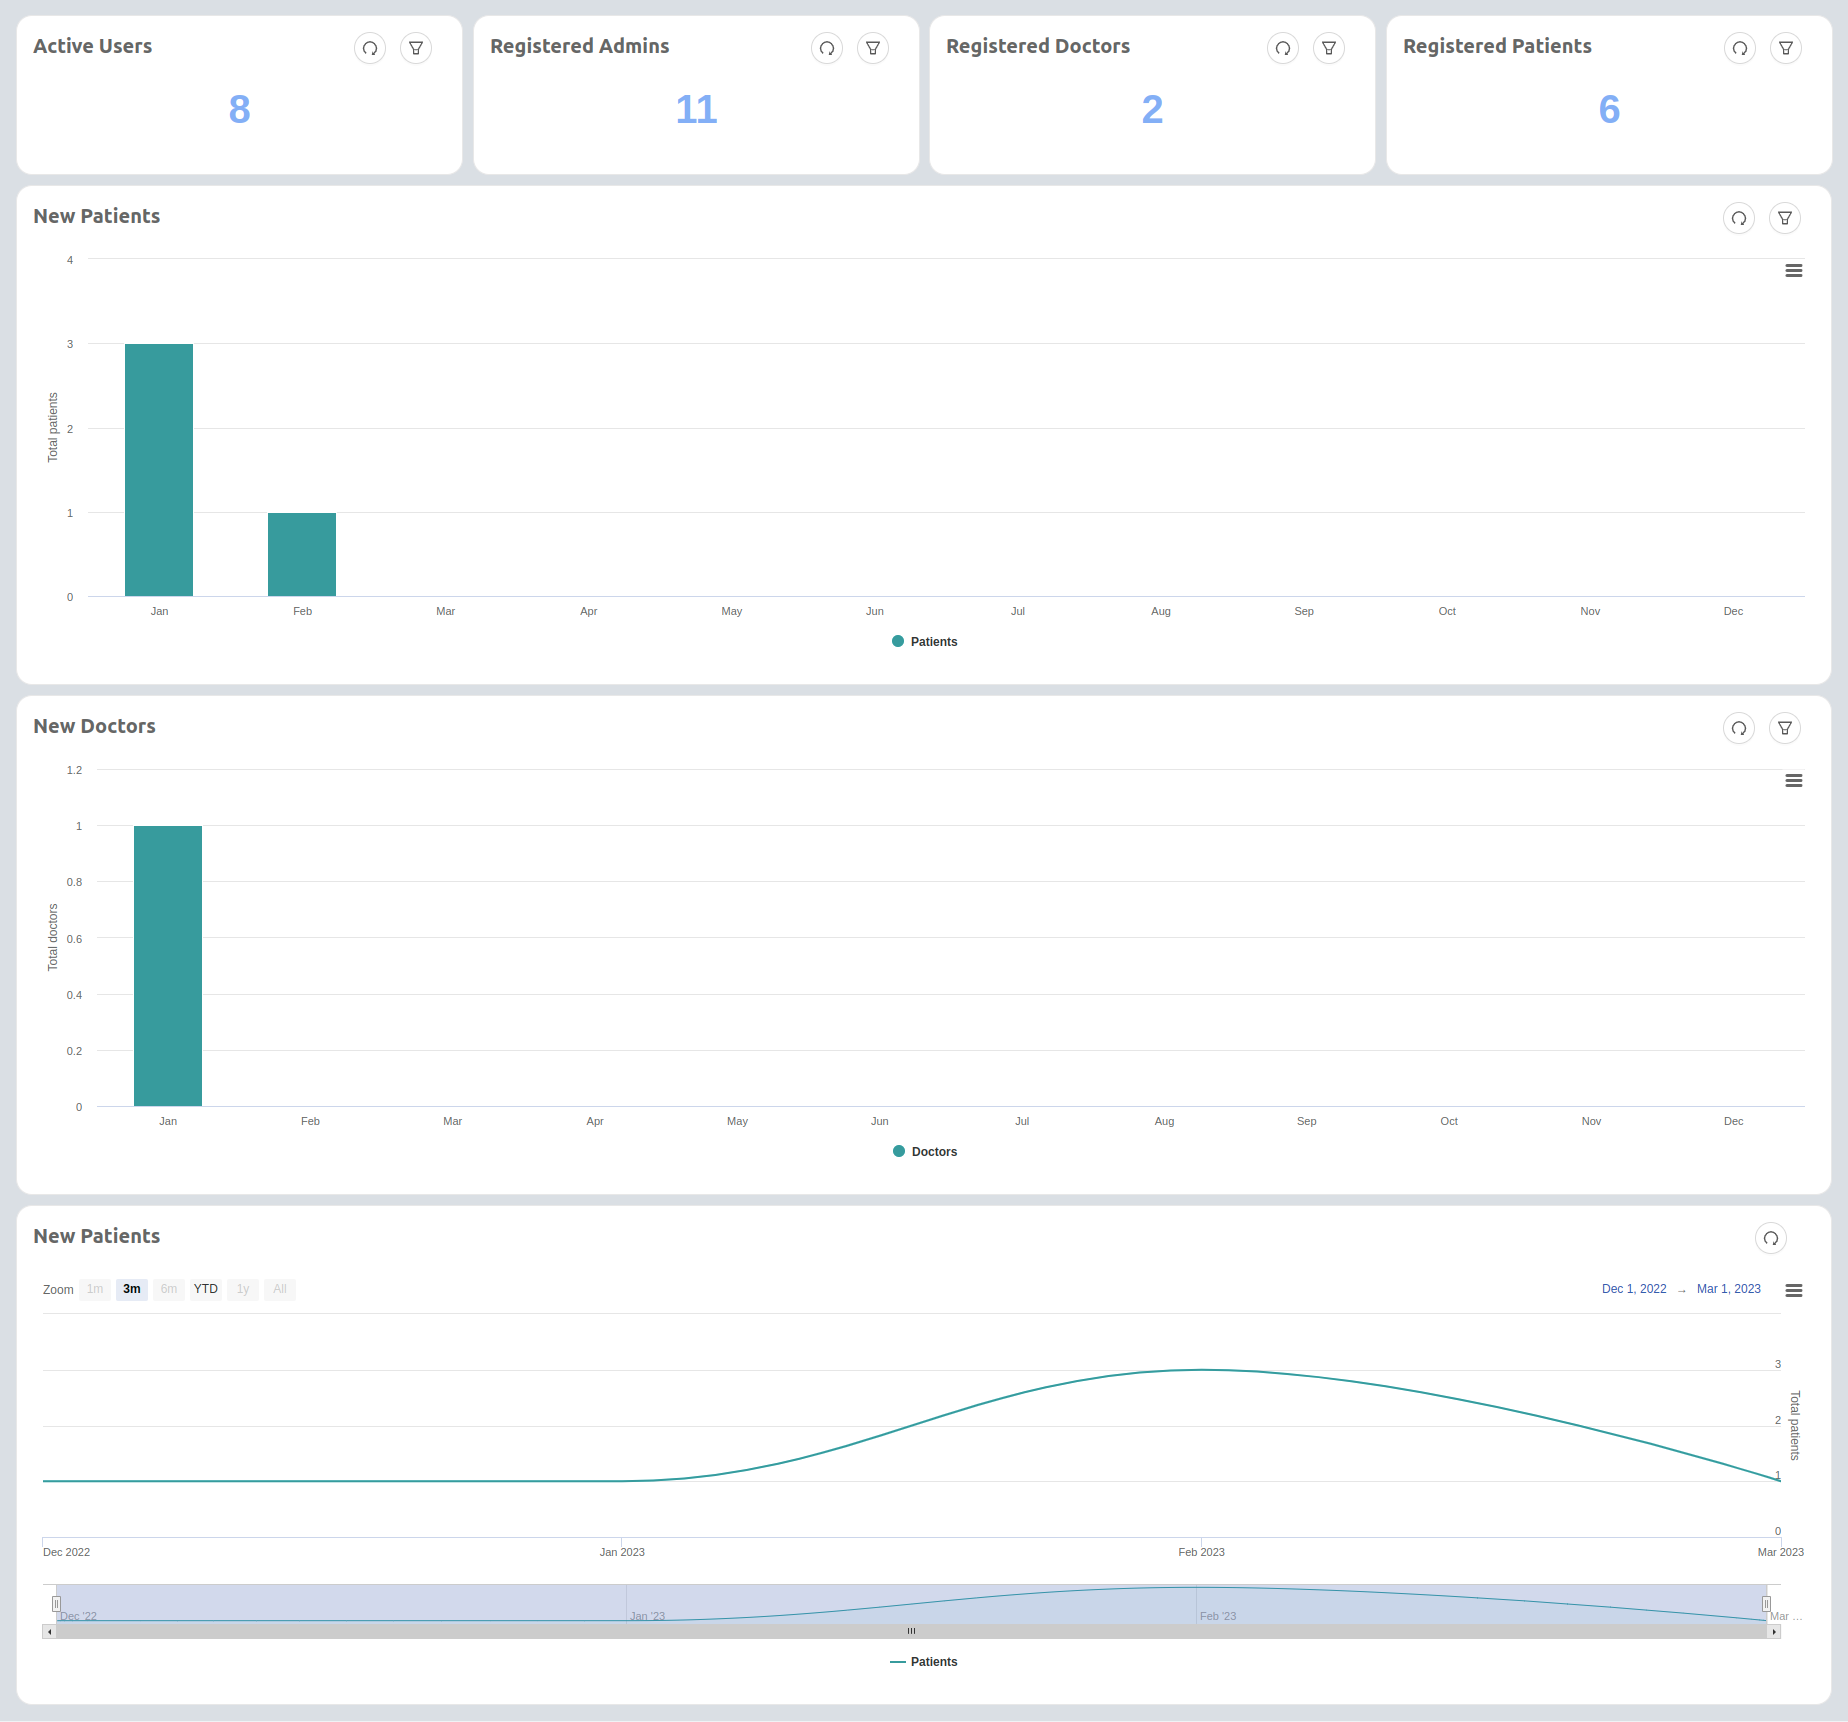
This dashboard contains these KPIs
-
Active Users: Total number of unique active users on the platform in a certain period of time. By default, it shows unique active users since the beginning of the project.
-
Registered Admins: Total number of registered admins in a certain period of time.
-
Registered Doctors: Total number of registered doctors in a certain period of time.
-
Registered Patients: Total number of registered patients in a certain period of time.
-
New Patients monthly: Total number of new patients per month.
-
New doctors monthly: Total number of new doctors per month.
-
Total patients per month - cumulative: The running total of the new patients grouped by month.
Services Dashboard
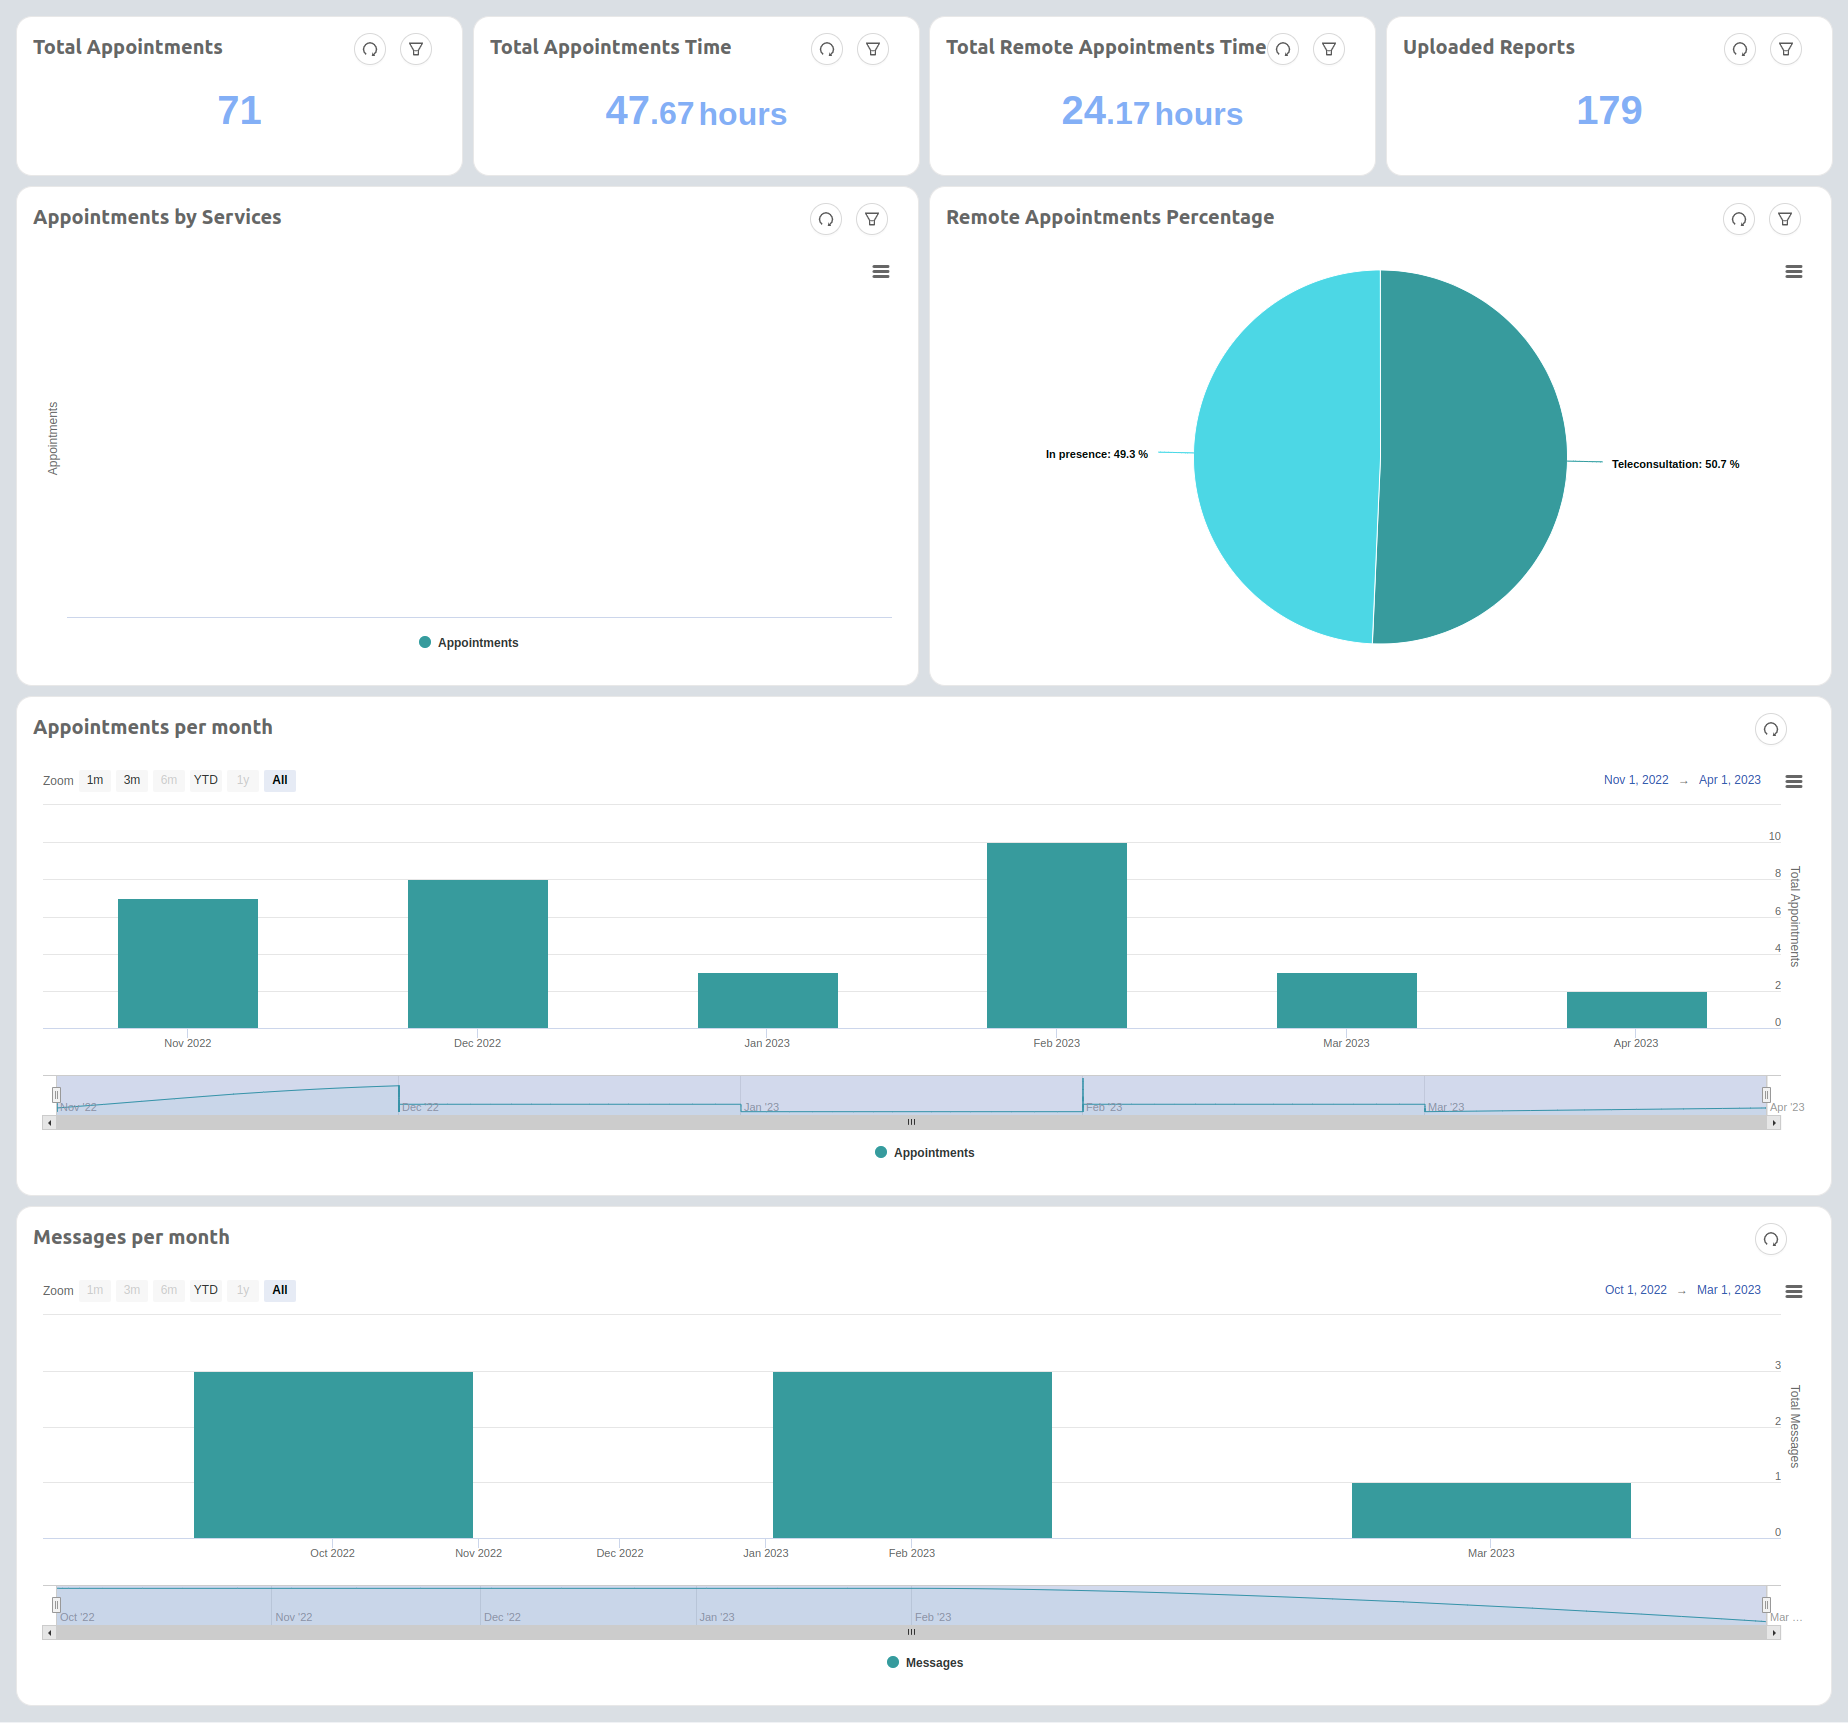
This dashboard contains these KPIs
-
Total appointments: Total number of appointments in a given time period. Filterable by visit type or by doctor.
-
Total appointments time: Total number of hours of in-person appointments. Filterable by doctor.
-
Total remote appointments time: Total number of hours of remote appointments. Filterable by doctor.
-
Uploaded reports: Total number of reports uploaded in a given time period.
-
Appointments by service: Total number of appointments by visit types. Filterable by doctor.
-
Appointments percentage: Ratio of in-person and remote appointments.
-
Monthly appointments: Total number of appointments grouped monthly.
-
Monthly communications: Total number of communications grouped monthly.